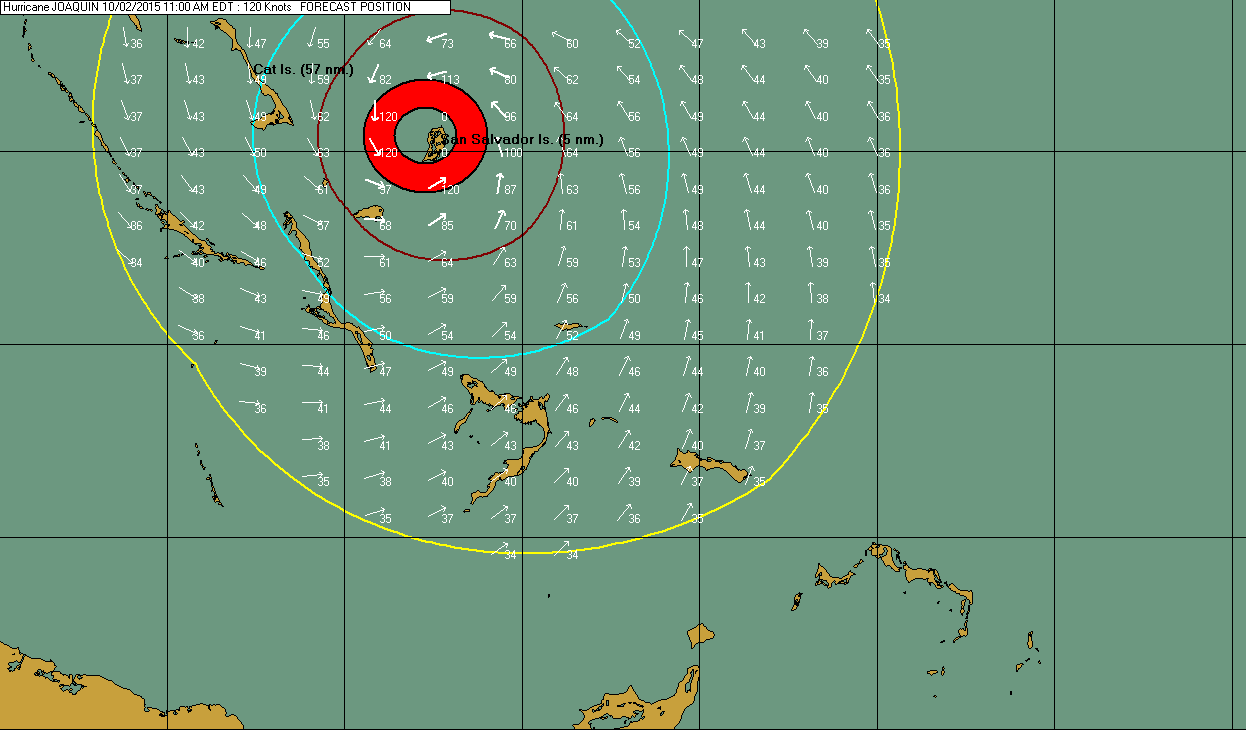
12 noon Oct 1st,2015 Hurricane Joaquin is pounding the central Bahama Islands of Little San Salvador and Acklins/Crooked islands as a major hurricane and this could continue for another 24 hrs before exiting the Bahamas. These islands were last affected by Hurricane Sandy in 2012 but only by the surrounding tropical storm force winds so Joaquin will be a completely different situation. The combined population of these 2 islands is roughly 2,200 full time residents that will likely never forget Hurricane Joaquin . These islands are hit directly by hurricanes roughly every 5 years on average so we hope the experience pays off for dealing with a hurricane as intense as Joaquin. The image below courtesy of PC weather products shows a very intense hurricane passing over my #15 pick to be impacted by a named storm this year Little San Salvador Island on friday morning while moving north.

As of this post there has been significant changes to most global models shifting east to be more in line with the ever reliable ECMWF European model. While some others such as the tropical models like the GFDL & HWRF continue to show a potential landfall in the mid Atlantic region of the United States. While this story is still ongoing we have to ask the question of why there always seems to be a difference in guidance between the ECMWF (euro) & the GFS (American) models on a consistent basis. After sifting through numerous papers on the ECMWF the main culprit appears to be the ability of this model to weed out false forecast’s quicker and more efficiently than the GFS . Now there have been some recent upgrades to the GFS but apparently there is still more work to be done to effectively compete with the euro model and we hope that more computing power can lower the errors. Lets face it when you look at a plot of spaghetti models and see the majority using GFS input turning Joaquin towards the U.S the media goes nuts and the hype especially on social networking spreads like wildfire. I always tell people if the GFS and ECMWF agree on a similar track then the message can become more clear lowering the the doubt of what areas may be impacted.
Now compared to the Bahama islands the potential landfall area in the U.S has far less hurricane experience from Hitonhead Island S.C average a hurricane every 8 years with Norfolk Virginia getting a hurricane every 12 years. This makes you understand why a hurricane hit forecast puts more stress on residents not used to the drill or used to glancing blows rather than direct hits. The North Carolina outer banks however is the most impacted area by hurricanes, hit even more frequently than the central Bahamas so they are more familiar with the drill and preparations required for a direct hit. The National Hurricane Center does a very good job with the cone of error not swaying too much one way or the other based on wild fluctuations of certain models and social media hype. You can tell the respect NHC has for the ECMWF model as they never turned the cone to dive into the mid Atlantic like the GFS showed but rather cautiously bent the cone. Fluctuations of model tracks and uncertainty of the future is why it is so important to prepare well in advance of the average time frame that your area typically gets impacted. The hurricanecity.com database shows 152 locations data of hurricane history in the Atlantic basin with a graphic at the top of each page showing the most likely time based on averages to be impacted.

As is always the case with statistics hurricanes can always hit earlier or later than the average hit date so prepping at the beginning of the season is always the best bet. This may be my last post on Joaquin unless the threat to the U.S increases then I will be back with my impact cities. Until then do not take your eyes off Joaquin until it moves into the cold waters past the Canadian Maritimes or worst case scenario inland.
