Lower number of named storms, new forecast techniques added & cities more spread out than last year.
According to model data it appears we will have weak elnino conditions in the East Pacific at the height of or later in the Atlantic hurricane season. So what does this mean? a chance of increased wind shear across parts of the Atlantic basin approaching the height of the season Sept 10th. Tropical systems like to develop when calmer conditions are present in the upper levels of the atmosphere. Most development in the Atlantic occurs between August and the end of October when conditions are ripe but it could be different this year. As of just before this post the water temps in the enso region have somewhat cooled but this could have been caused by a temporary shift in trade winds and I still think deep into the hurricane season these SSTs will increase to near or at weak Elnino conditions.

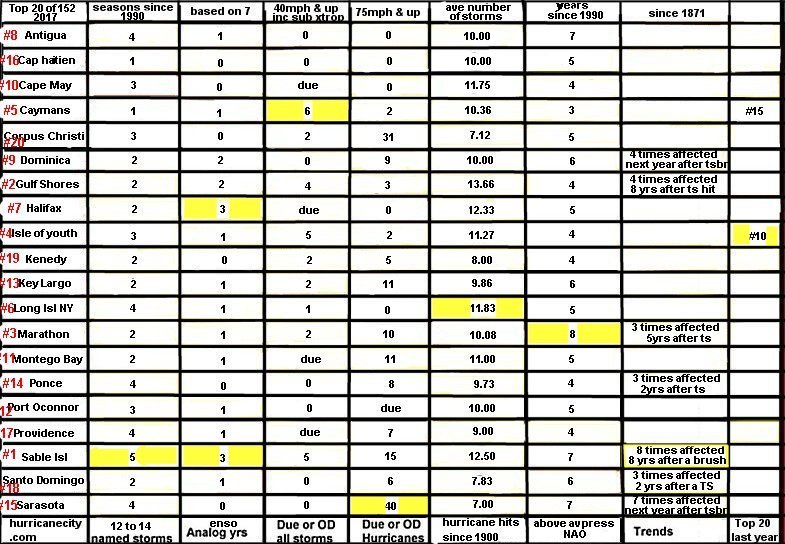
For an elnino event to be established there needs to be a three month period of 0.5 degrees or greater SST’s in the nino 3.4 region and most models show this happening. This is a strong feature in my eight criteria put into my city predictions based on how many named storms there could end up being. This year I am calling for 12 to 14 named storms, last year I was calling for 14 to 16 named storms and we ended up with 15 named storms in the basin. As a result there will be practically a whole new set of cities chosen to be impacted by a named storm for this year with a couple of leftovers from last season. As for elnino comparisons I researched past seasons with similar SST temperatures in the East Pacific and was able to subjectively choose seven past years that come close to lining up with what the models are projecting listed below.

So now that you know my main factors for making my city predictions I need to make it clear that one or more of my top 20 may not meet the criteria above. There are several other methods used in arriving at my final list and sometimes these change from year to year depending on each methods success. This years list of methods not necessarily listed in the order of importance below.
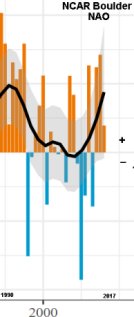
Using the chart below each location is calculated and the highest amount in each category wins (highlighted in yellow) there are no tie breakers so more than one may be highlighted in each category. My top five picks are the winners with the most yellow boxes, in tie situations weight is put on the significance of each criteria. Fourteen of the locations had no yellow boxes but the closer numbers to the top five locations get the nod in the positioning. Due to the uncertainty of the NAO criteria it is given very low value in positioning.
Each & every year there will be one or more locations affected that I did not pick. My past track record would indicate if you are in my top 20 you statistically have an increased chance for a named storm. If you are in the top five there is a pretty good chance 2 or more locations will be impacted. Last year for example 9 of 20 were impacted by a named storm, not bad considering I am plucking from 152 locations across the Atlantic basin. If you were told you had a 50% chance of being struck by a vehicle at a certain location you would look not just twice maybe three or four times. There is no harm in preparing for hurricane season regardless of your city on this list or not better safe than sorry. It is advisable to know your evacuation & flood zones,know where you will evacuate to and how you will get there,do they take pets?. As time goes by I will be adding my past years predictions notes and verification of what worked or did not work since 2003. This information will be added to my predictions page at Jim’s Predictions where you will also find maps & videos of my predictions. Thank you for your time and good luck this hurricane season.

