Since 2003 just before or at the start of the Atlantic Hurricane season I release my city predictions with areas I feel have a high to moderate risk of being impacted. Once again this past 2017 Atlantic Hurricane Season I accurately predicted 3 of my top 5 locations to be impacted by a named storm or hurricane. Of the remaining 15 locations 12 were impacted ,11 of these locations were impacted by hurricanes. Even if I was not the one making these predictions I would sit up in my chair and pay very close attention. Since 2003 I have only had 2 seasons where none of my top 5 were impacted by a named storm,even in a couple of seasons of less than 14 named storms I have hit on at least 1 of my top 5. For example in 2009 we ended with 9 named storms I still had 2 of my top 5 impacted. The beauty of these predictions are that I use sometimes up to 8 different criteria to choose my top 20. For example this past season one of my criteria is ENSO (El Nino Southern Oscillation) in where model projections in April indicated a higher chance of a low to moderate El Nino (warm phase of the southern Oscillation) during the height of the hurricane season. I released my predictions on May 15th based on a weak El Nino which never happened but was also involved in only 2 of the 8 criteria. The other criteria had little to do with the amount of named storms rather return rates and environmental conditions such as the NAO (North Atlantic oscillation).
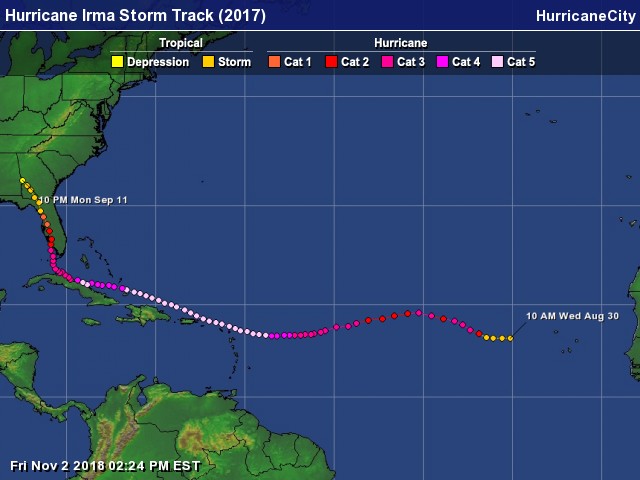
On September 10th Hurricane Irma hit the lower Florida keys with 130mph winds , my #3 pick this year was Marathon,Florida . This location made my top 5 for the 2017 season based on only 1 of my 8 criteria . Since 1990 Marathon has been impacted when there is an above average NAO in April an amazing 8 times, now i’m just a stats guy that will leave that science to the PHD experts. Marathon was also statistically 2 years overdue for a named storm and 10 years for a hurricane.
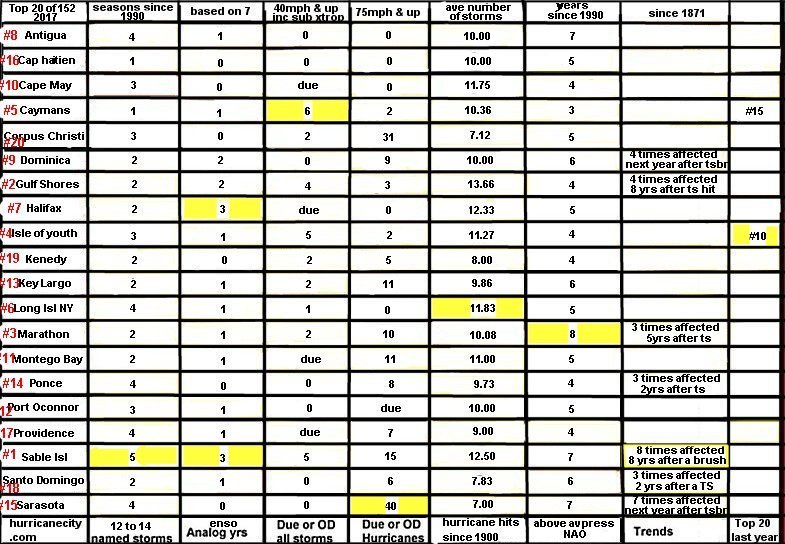
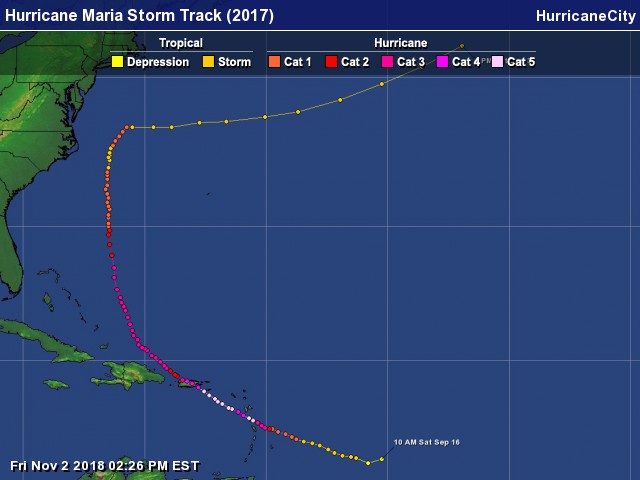
Sometimes when viewing these predictions it can be just as useful to see who is not listed. Some very high hit locations that are impacted just about every other year such as Cape Hatteras and the N.W Bahamas were not chosen and had minimal impacts during the 2017 season. Some years there are hard hit areas that I do not pick but this year it was different. Even Ponce,Puerto Rico hit by Hurricane Maria was my #14 pick and those that have followed my predictions closely know I do not pick Puerto Rico locations very often. Gulf Shores,Alabama my #2 pick impacted by Hurricane Nate was chosen because they usually get hit in more active seasons and the chart above shows 13.66 named storms the closest to our final 17. I like using the variation of different criteria as sort of a fail safe scheme but honestly the most important factor are return rates. I do not pick Texas locations that frequently but this year I narrowed it down to Port O’Connor,Texas at #12 that was just missed dead on by Hurricane Harvey as it hit Aransas Pass with 130 mph winds.
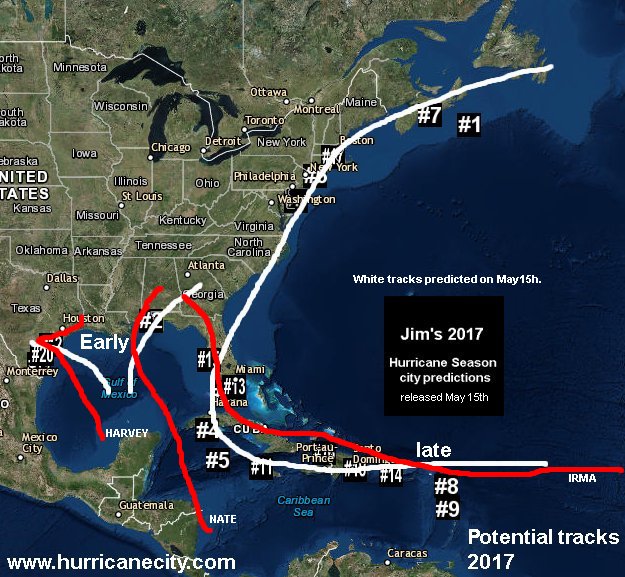
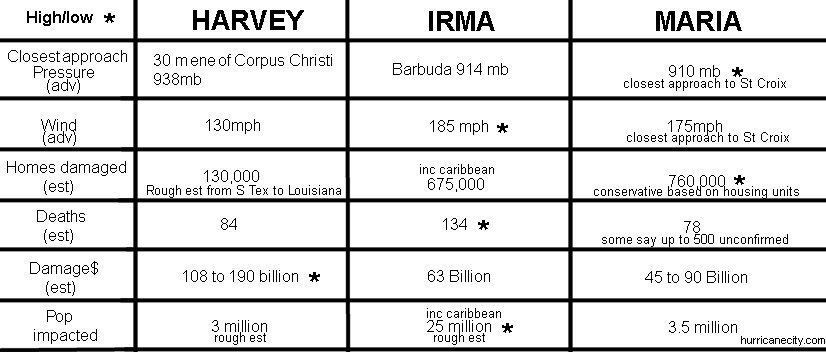
These predictions are not perfect in fact my #1 pick has not been impacted since 2009. This years #1 pick was the tiny island well south of Nova Scotia called Sable Island. There were a couple of systems up that way but passed too far south of the island or became post tropical to be considered a brush. Had that been the only area impacted I would have kept my track record intact with minimal disruption to human lives which leads me to my final points. No doubt this has been a violent hurricane season for many with 3 major hurricane hits and I did rank the big three. There were hundreds of thousands of properties destroyed with lives turned upside down but in comparison with the amount of square miles impacted the total death toll was low. I would like to think that some people in the Florida Keys “may” have seen these predictions before the season started. The picture at the top is me at a Florida Keys seminar on hurricanes a few years ago and who knows maybe someone remembered to take a look at hurricanecity made the proper preparations including getting out. Maybe you can read my face in that picture thinking “you all are in deep shit” but make no mistake Irma was no where near the worse case scenario for the keys.Had Irma not tangled with Cuba the surge & wind destruction wold have surely taken more lives. I think about the tiny island of Barbuda left uninhabitable by Irma and my #8 pick Antigua narrowly missed by the core and how different things could be there if the core passed over. To wrap things up the main concern going in to next year is not how many named storms but “where will they go?” I will release my predictions for 2018 probably some time in late May so stay tuned for announcements. In the mean time I wish everyone impacted by these intense hurricanes the best in their recovery efforts and hope these areas are built more hurricane resistant………..Jim Williams
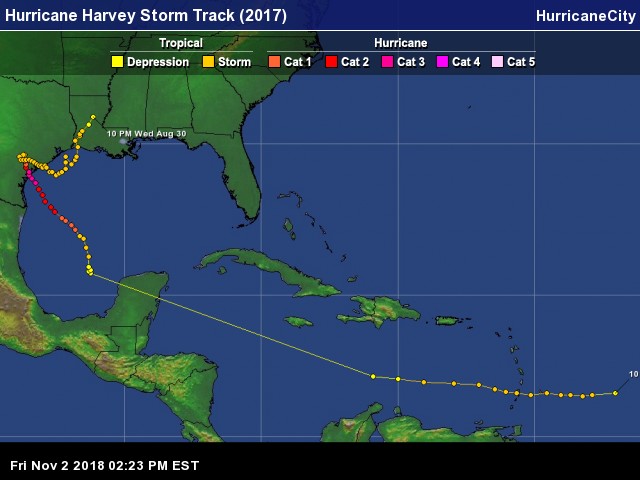
 What a hurricane season it has been with three major hurricanes hitting land in the Atlantic basin starting with Harvey then Irma and finishing with Maria all within 27 days during the height of the season. Each Hurricane was devastating to the communities affected and it is extremely difficult to rank these three. Each impacted large areas,killed many and crippled infrastructures. Now what does rank mean? I will rank these three hurricanes based on impacts on human lives. I will give descriptions of each of the three hurricanes in order in which they developed (stats may not be exact as these are ongoing disasters). It all started with a tropical depression east of the Windward Islands on August 17th and like it’s predecessors early in the season struggled to survive due to unfavorable conditions aloft. The system weakened to an open wave in the central Caribbean, traveled west crossing the Yucatan Peninsula in the western Caribbean where if finally found a favorable position with low shear and very warm sea surface temperatures. On August 24th it developed into Tropical Storm Harvey in the Bay of Campeche and at this point the 2017 Atlantic Hurricane Season took a turn for the worst. In less than nine hours Harvey would become a hurricane setting the stage for several powerful hurricanes in less than a month.