2024 Hurricane Season landfall predictions

By : Jim Williams hurricanecity.com as each Atlantic hurricane season approaches you will hear and read about how many named storms there will be, the accumulated cyclone energy ACE, how many majors etc. but not much about where named storms could go.

The Atlantic hurricane season starts on June 1st and runs through November 30th. Each season some of the cities/islands in the database https://www.hurricanecity.com/cities.htm will be impacted possibly with significant impacts. My process begins by determining how many named storms there could be a busy vs moderate vs slow season makes a big difference in what areas could be impacted. After my range is determined I work on my ten criteria listed below to choose my top 20 out of 139 that possess some of the criteria. After the top 20 are chosen the number crunching begins to determine which of the 20 matches the most criteria to arrive at my top 5.

“If you know your cities history it’s only a matter of time, if your city/island is past it’s statistical due date watch out”

Several factors determine how many storms I expect with most ENSO models indicating a La Nina pattern which is favorable meaning less wind shear for developing systems , Warmer than normal sea surface temperatures and lower pressures. I also factor in what agencies are saying in regards to numbers of named storms then add storms for potential frontal systems that transition to become tropical along with recent predictions which have been lower than what actually happened. So this year I am calling for 28 to 30 named storms of which 10 to 12 will become hurricanes 4 to 5 of those major 115+mph .

The landfall predictions do not determine what intensity or exactly how close named storms will come to my chosen locations. My average is around 50 to 60 miles away give or take so it does not take a direct hit to be considered impacted. My last full forecast done in 2021 before health issues was an average of 41 miles from the center of the storm. Below is my list of criteria with a brief description of each and whether the top 20 have been impacted when this happened.

  • Seasons since 1990 with an average numbers of 19+ named storms with only Brownsville TX and Manzanillo Cuba reaching this criteria.
  • My chosen analog years based on projections of reaching a La Nina season following the strong El Nino from 2023. 1973,1988,1998 and 2010. The top 20 impacted in any of those years Mole St Nicolas Haiti 3, Cancun MX, Cozumel MX, Honduras, Miami FL, Nuevitas CU, Port Salut Haiti each with 2 . Abaco & Andros BAH, Brownsville TX, Manzanillo CU, Morgan city LA, with 1.
  • Statistically due or overdue for 40+ mph includes brushes. Only four areas were overdue in top 20 Andros, Bimini and Nassau BAH and Pensacola FL 1 year overdue, with Abaco BAH, Cancun & Cozumel MX, Cayman islands, Ft Lauderdale, Miami and Palm bch FL, Mole st Nicolas Haiti (nw) all due.
  • Statistically due or overdue for a hurricane strike 10 of the 20 years overdue Nassau BAH 1, Manzanillo CU 2, Morgan city LA 2, Cayman isl 9, Honduras 11, Ft Lauderdale & Palm bch 12, Bimini BAH 13, Miami FL 13, Brownsville 23.
  • Average number of named storms when hit by a hurricane 15+ named storms zero none met criteria.
  • Impacted in seasons when between June and November the dominant feature was a Neutral North Atlantic oscillation. No one knows what the NAO will be at this time but I deployed AI to do a sequence using historical data and it chose Neutral. Based on a neutral NAO cities/islands with 4 plus impacts since 1990 are listed. Abaco isl BAH 4, Elizabeth city & Morehead city NC 4. To follow the NAO stats check https://www.cpc.ncep.noaa.gov/products/precip/CWlink/pna/norm.nao.monthly.b5001.current.ascii.table
  • Trends going back to 1871 I try to figure out patterns such as if a city was impacted in 2023 how how often do they get impacted the following year. If it was last impacted 3 years ago how often do they get impacted 3 years later. In my top 20 nine of those have unique trends with Cancun MX winning that criteria. Last impacted 3 years ago they have been impacted 3 years later 7 times.
  • CSU analog years additional years to the ones I chose above are 1878 and 1926 so who got impacted most during those years? 9 of my 20 matched both years. Abaco, Bimini and Nassau BAH , Miami, Ft Laud and Palm bch, Caymans, Manzanillo Cuba (se), Nuevitas Cuba (north c).
  • Were any of my top 20 picked last year? each year my picks don’t get impacted the following year odds go up they will be. Four were picked last year Abaco,, Andros, Bimini and Nassau.
  • Who in my top 20 get impacted during the expected La Nina seasons? 6 of the 20 are in the top 1/3 of locations impacted in La Nina years. The winner in this criteria is Elizabeth city, NC with 11 impacted since 1950 next was Honduras with 10.

Chart showing criteria with yellow shaded areas winning each criteria. Areas with the most yellow are higher ranked. Tie breakers are based on strength of systems or amount of impacts. #1) Great Abaco Island Bahamas has 3 with 1926 analog weighing huge.

Now you may ask what criteria do you put the most weight on?, the two most important especially when figuring my top 20 are overdue all storms and trends going back to 1871. You also may ask why was my city or island not included in your top 20? Areas on the bubble were Puerto Rico which did match CSU analogs 1878 and 1926, Lesser Antilles including ABC islands overdue for hurricane strike and analog 1988 , Nicaragua analog 1988 ,2010, N.E US analog 1878. It seems as though in years with La Nina conditions stronger ridging takes place pushing systems further west and south which would impact the Caribbean and Gulf much more.

Each season I do landfall predictions I make a map with two dominant tracks I think could happen. These have been surprisingly good in some years practically matching tracks that actually happened. Below are the tracks with one mid season and one late I added potential width of hurricane force winds. This will forever be known as the pitchfork map if I end up being correct..

I know some of you that watched the video are wondering what was that explosion noise for Miami. That is my ticking time bomb pick for 2024 reserved for areas that are way overdue especially for hurricanes.

Miami has a hurricane return rate of once every 12.67 years since 1871 for the core of a hurricane to give the city hurricane force winds. Miami’s last direct impact was hurricane Wilma in 2005 Irma in 2017 was too far west and south so statistically should have been hit by 2010 so we are now approaching 15 years past that due date. This is extremely rare for Miami to go this long without a hurricane hit . Last time this happened was from 1966 Inez to hurricane Andrew 1992 or 26 years.

I cannot emphasize enough that if your city/island is not on this list does not mean you won’t be hit. Last year the hardest hit area Steinhatchee, FL was hit by Idalia as a cat 3, I did not have this area in my top 20.

All residents in the Atlantic basin need to pay close attention as the season progresses for threats to their cities and be prepared in advance. I suspect a good deal of the 139 locations in the HC database will be impacted this season, so now is the time to discuss your plans.

I will be live covering hurricanes making landfall at hurricanecity.com and providing the heads up to my mailing list which you can join by making a donation of $20.00 https://hurricanecity.com/donate.htm. To see my past years predictions and see how it played out visit my predictions page which goes back 20 years . To wrap things up I hope if your city is impacted from my list you email me to let me know and media that has any questions regarding these predictions can email me jim@hurricanecity.com , be safe and thank you for your time….Jim Williams

2021 Hurricane season what cities were impacted most?

Jim Williams Nov 30th,2021

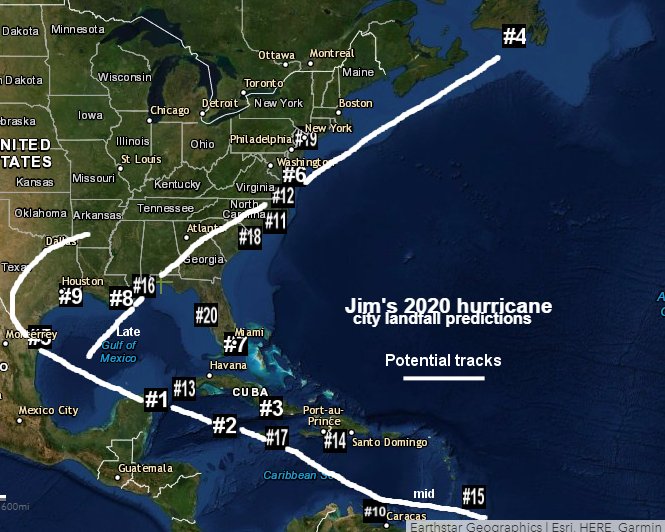
With all the talk each hurricane season about how many named storms there will be or how much accumulated cyclone energy will be generated what mainly matters is where they will go, will they hit land & where?

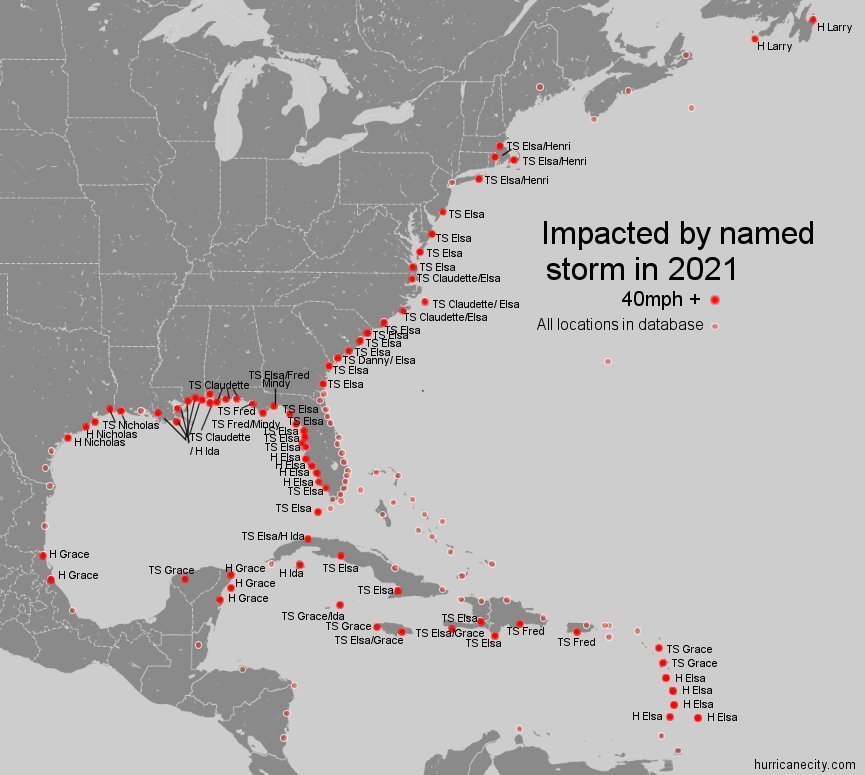
The database here at hurricanecity.com list’s 139 cities/islands in the Atlantic basin as evenly spread out as possible. If any of these locations were impacted by a named storm with 40+ mph it counts as an impact even as post tropical. So how did this past hurricane season compare to the extremely active 2020 season which had 30 named storms?

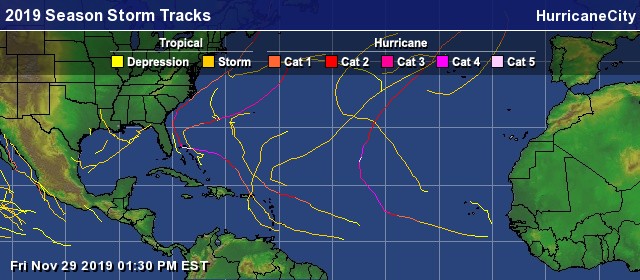
This year the Atlantic basin churned out 21 named storms during the 21 season how ironic.  Out of those 21 named storms 10 impacted one or more of the 139 locations or 47.62%.  Now compare this to 2020 with 30 named storms had a higher percentage of impacts 17 or 56.67% of all storms impacted land. The 2020 hurricane season also had far more hurricane impacts especially on the U.S mainland than 2021 did.

Hit map for 2021
Map showing 40mph + impacts for 2021

Of the 10 impacts in 2020 half caused significant disruptions to everyday life which is really what matters considering the entire hurricane season which runs from June 1st through November 30th.

 wind swath map

The most impactful hurricanes of 2021 were.

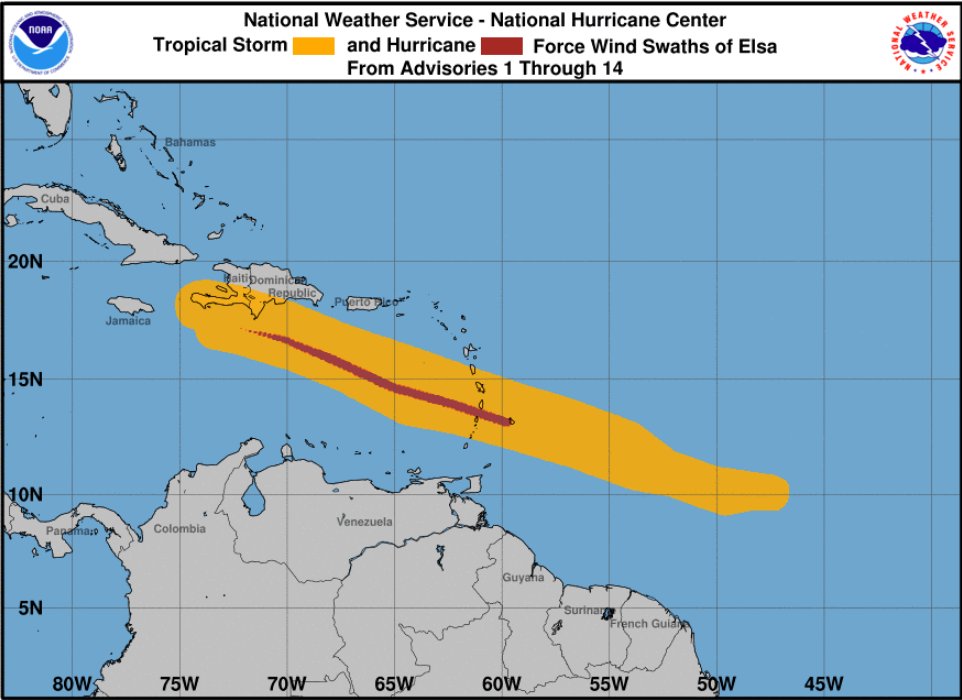
Hurricane Elsa early false alarm.

Hit the Windward islands on July 2nd with 85mph winds 743 roofs damaged. Database impacts: Dominica, Martinique, St Vincent brushed. Barbados, St Lucia, St Vincent hit.
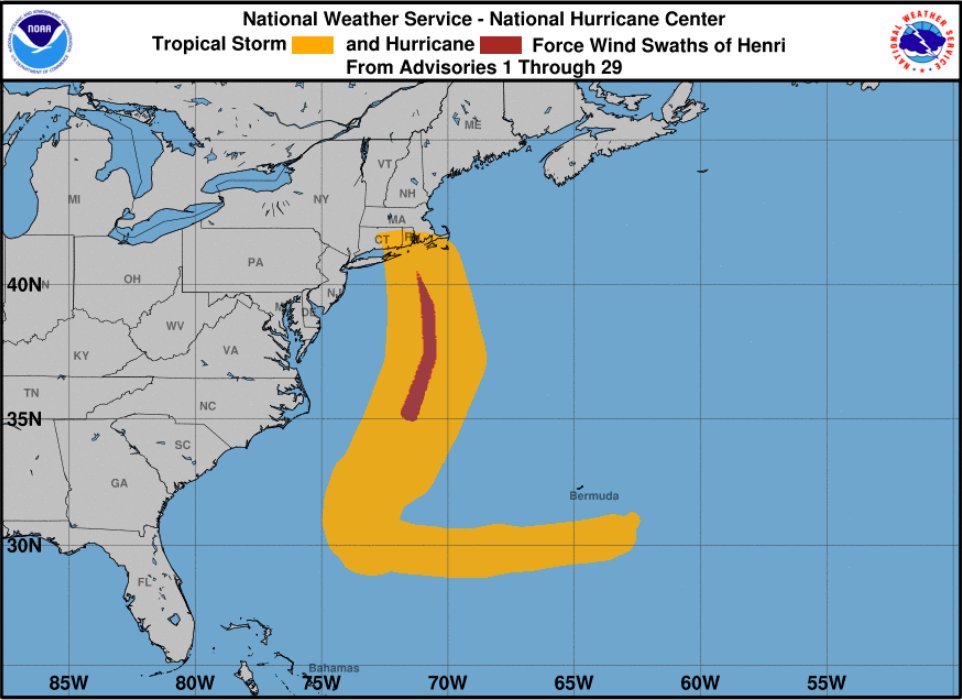
NHC wind swath map for Henri

Biggest tease

Hurricane Henri moved towards eastern Long Island and weakened to a tropical storm as it moved in on August 22nd but still caused significant damage & power outages in the N.E. 

Database impacts: Southampton LI ,Providence R.I, Cape Cod MA TS hit.

NHC wind swath Ida

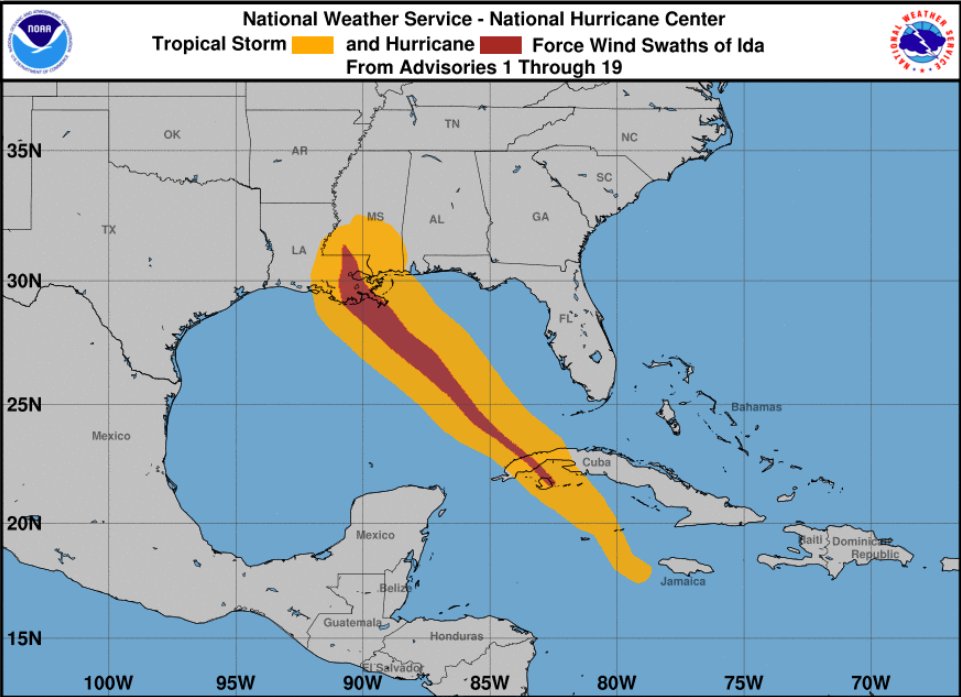
The biggest hit & story of the season.

Hurricane Ida hitting S.E Louisiana on August 29th with 150mph winds causing extreme damage and massive power outages.  Database impacts: Caymans TS br, Havana ,Cienfuegos CU br, Isle of youth, CU hit. Morgan city,LA ,Bay St Louis, Biloxi, Pascagoula MS all br, Grand Isle, New Orleans LA hits.

Power outage map Ida from poweroutage.us

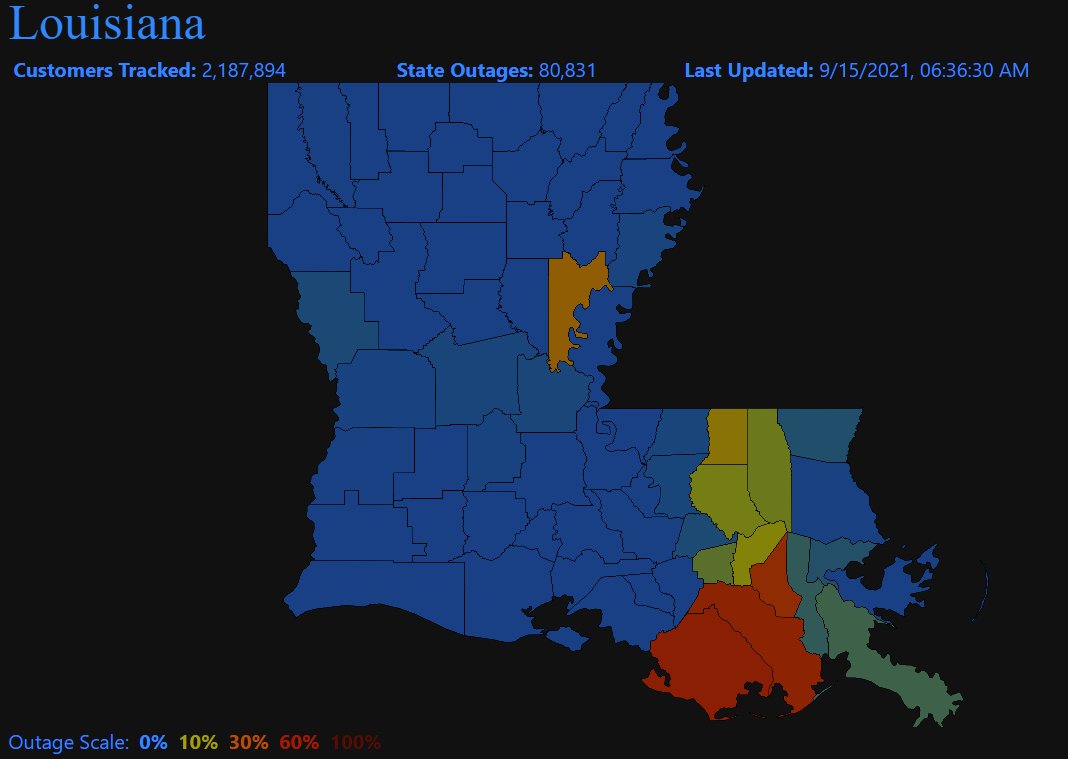
For many of the impacted areas in Red courtesy of poweroutage.us they were without power for several weeks.

Typical September recurve.

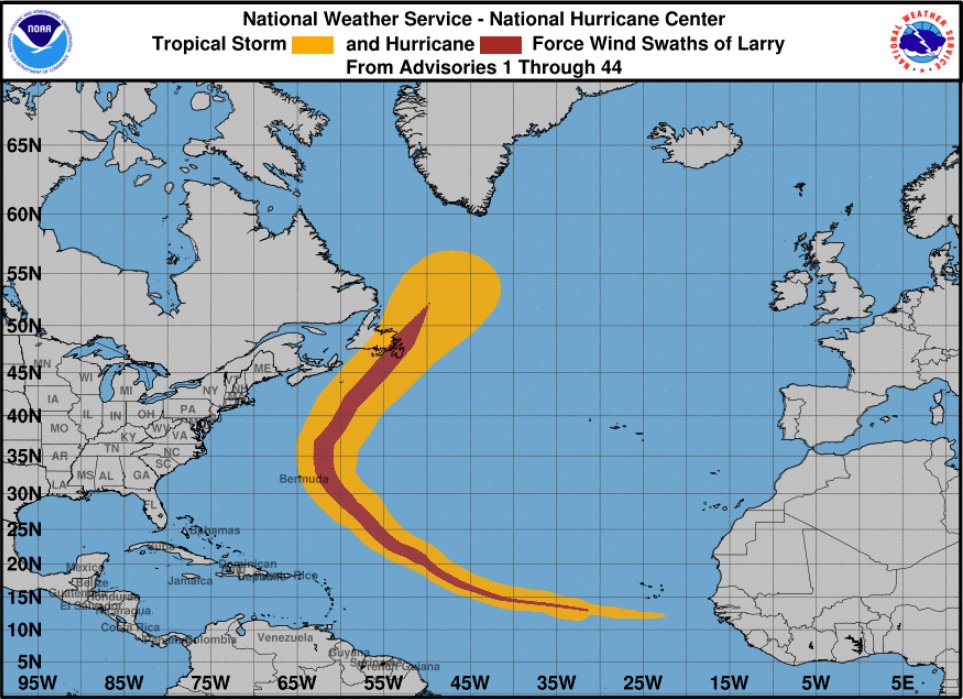
Hurricane Larry hit eastern Newfoundland with 75mph winds on September 11th causing wide spread power outages. Database impacts: St Pierre NF, br , St Johns NF hit.

National Hurricane Center Nicholas wind swath map

Packed a punch over small area.

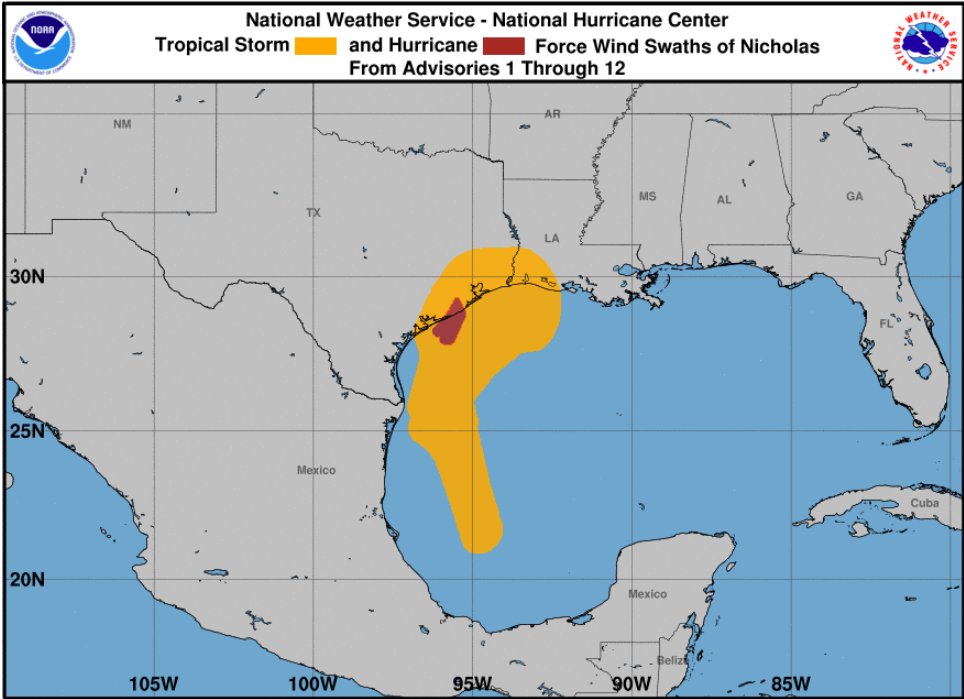
Hurricane Nicholas hit the upper Texas coast on September 14th with 75mph winds causing a large amount of power outages. Database impacts: Pt O’Connor ,Galveston, Pt Arthur all TS, Freeport TX hurricane hit.

Nicholas outage map

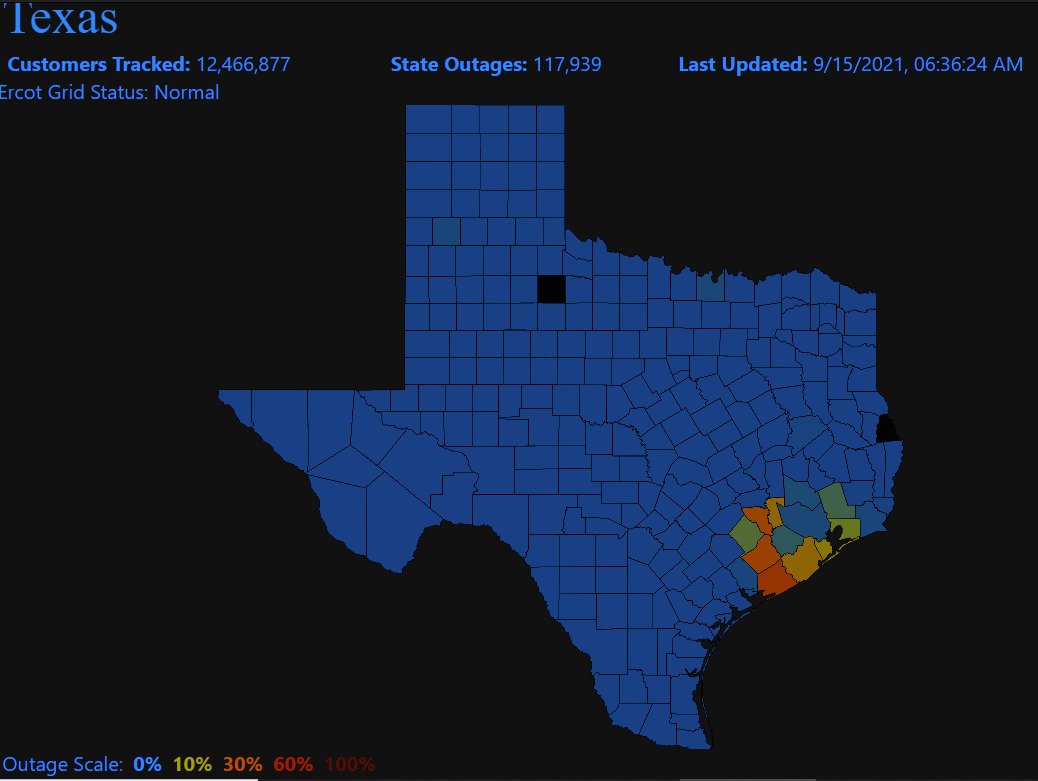
Widespread power outage as a result of Hurricane Nicholas but most power was restored rather quickly.

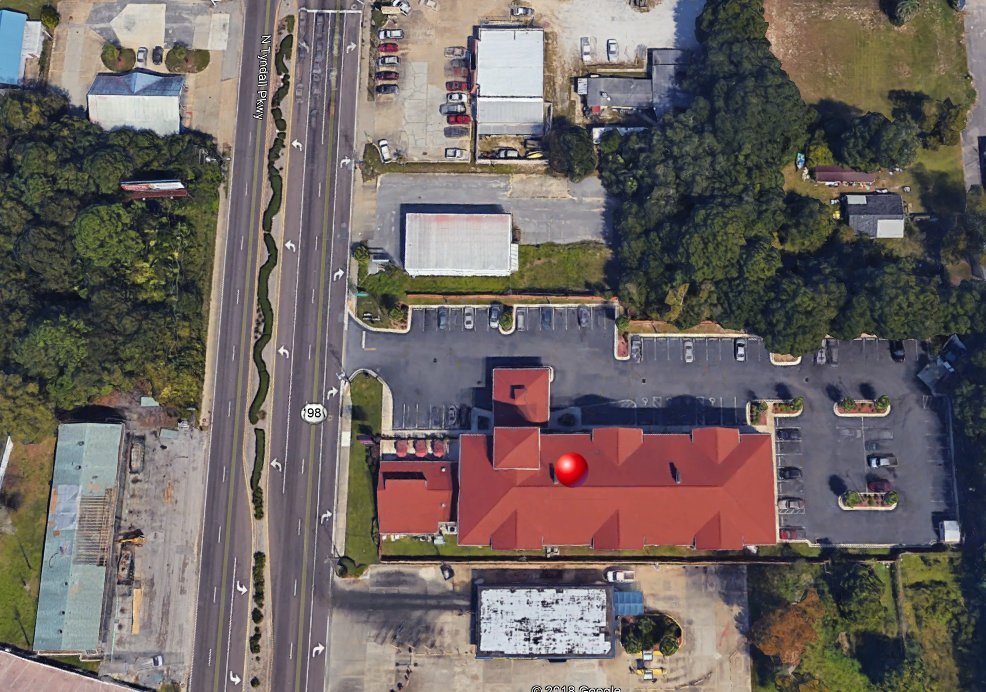
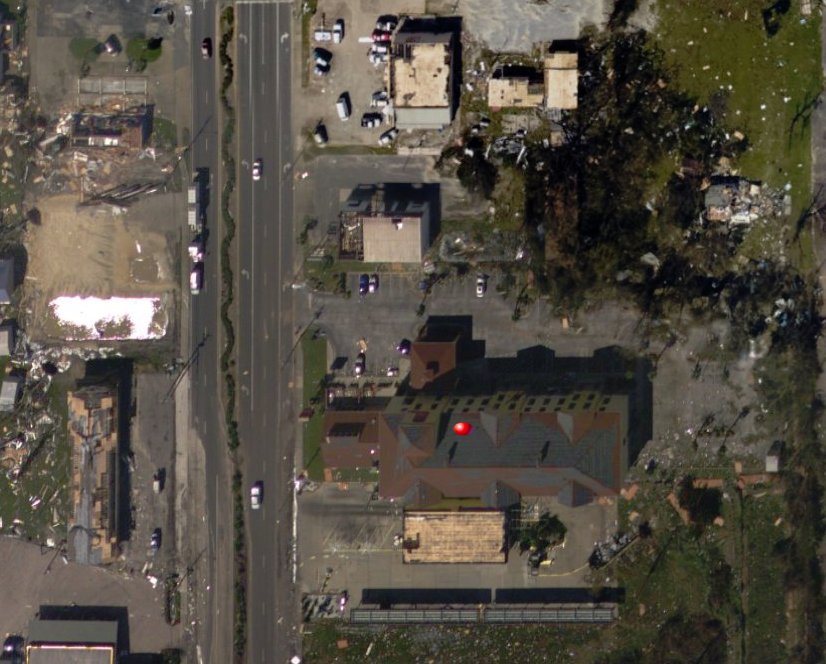
Hurricanecity coverage of hurricanes in 2021

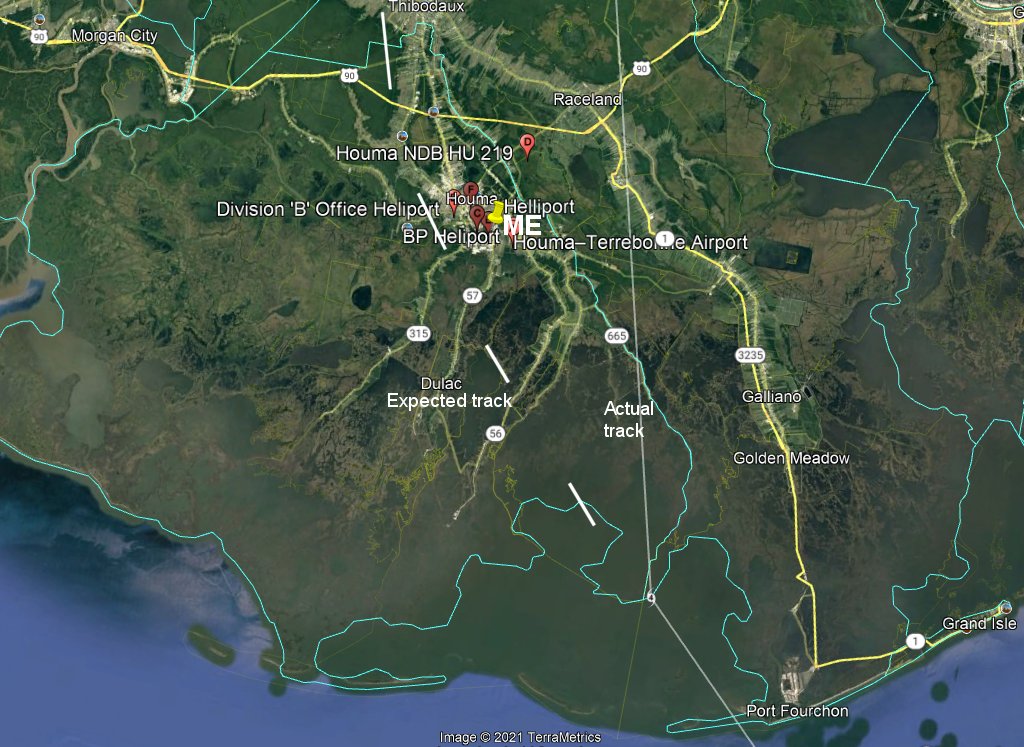
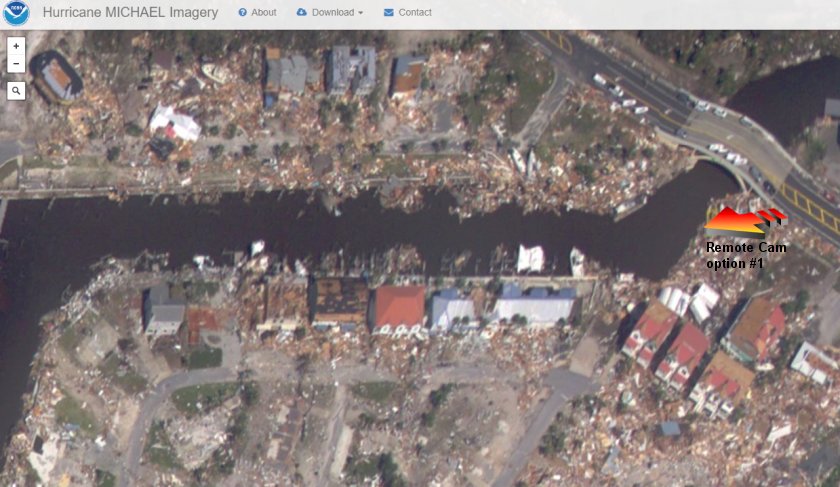
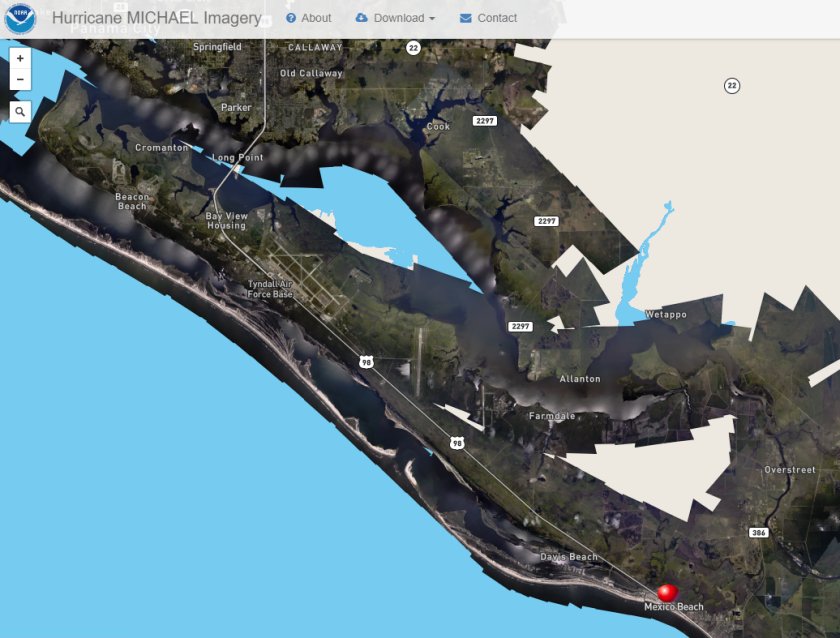
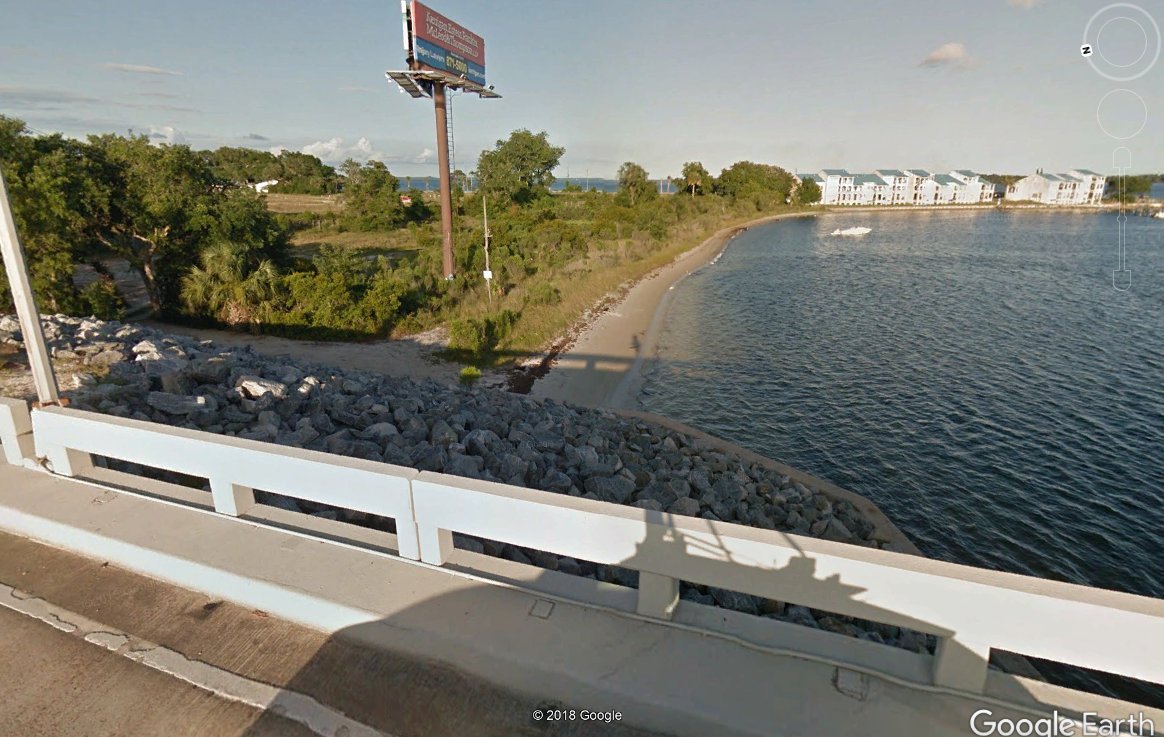
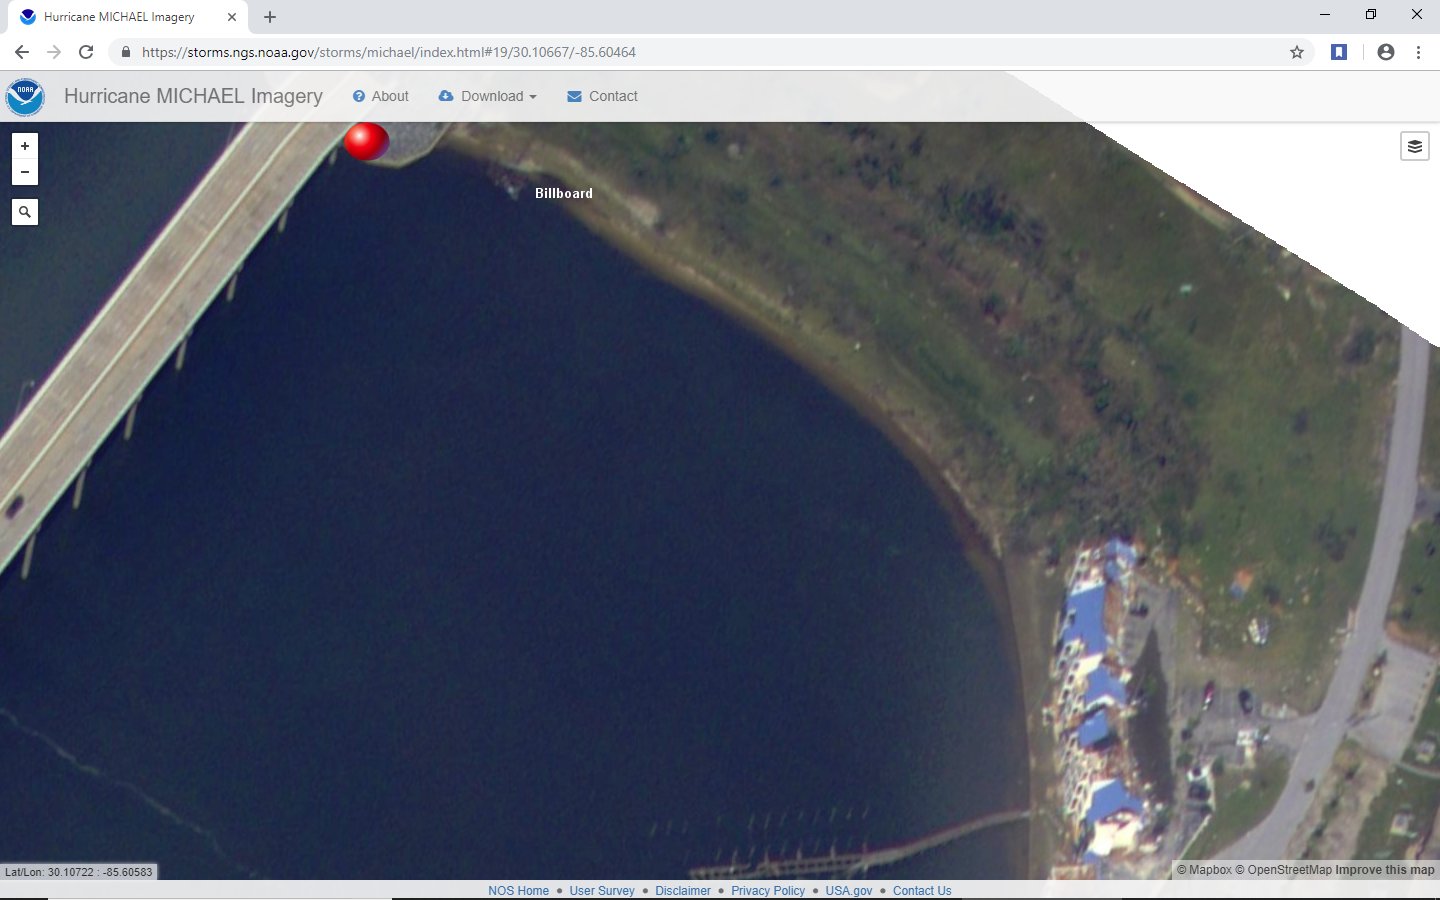
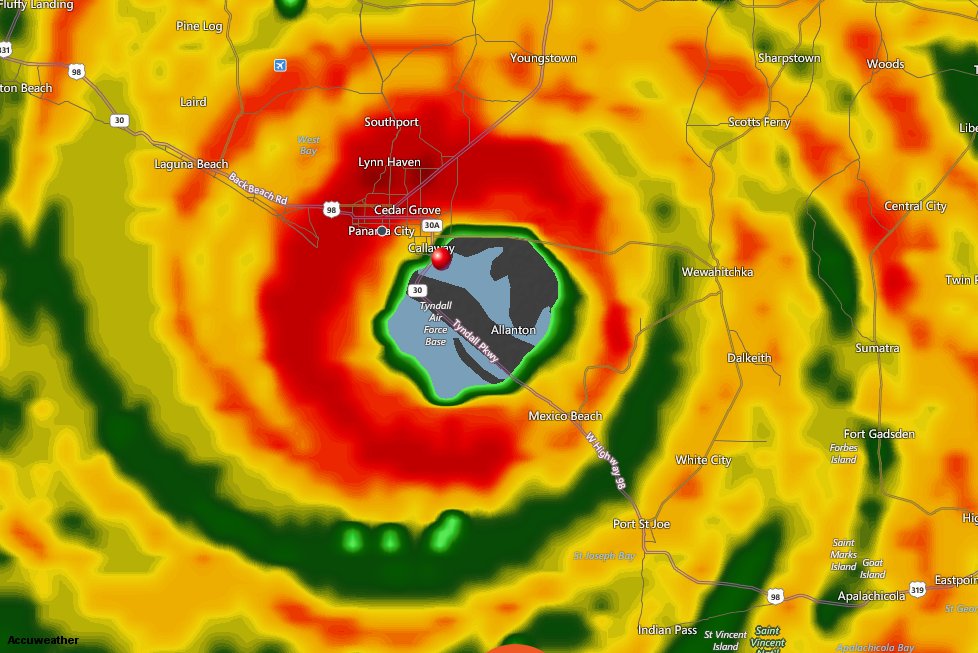
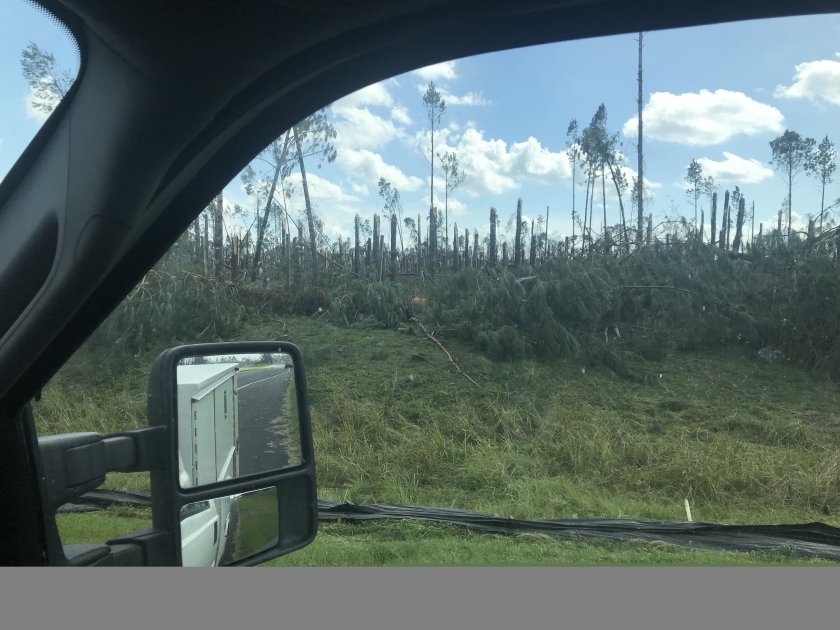
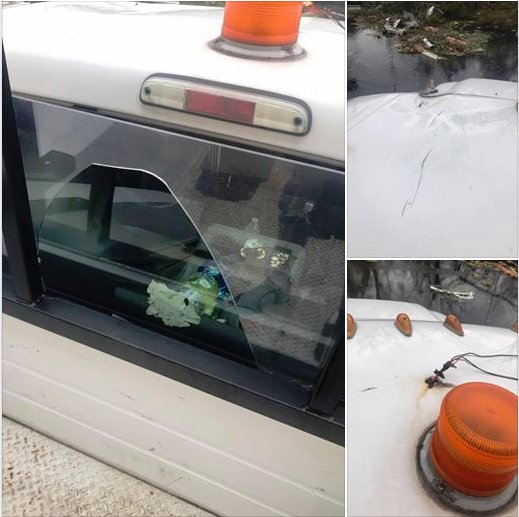
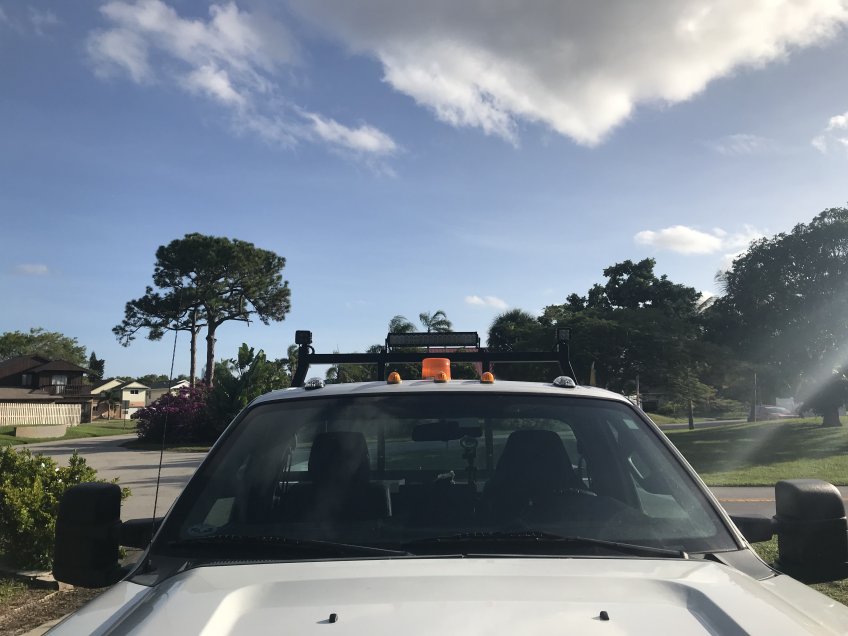
Looking back on the 2021 hurricane season there was one major headliner hurricane Ida which slammed S.E Louisiana on August 29th with 150mph winds. After the 2010 hurricane season it became clear that the way we would cover hurricanes had to change. Showing live streaming chaser feeds and webcams on the traditional “hurricane warning shows” became increasingly difficult due to copyright issues. With live streaming technology as well as the ability to stream to several media platforms at the same I decided it was time to hit the road and cover the hurricanes as in person as they hit. Since that time I have produced live video from hurricanes Matthew, Irma, Michael, Sally, Delta and this past season Hurricane Ida. This was a difficult hurricane to intercept as the track kept shifting east and the storm surge threat was forecast by the National Hurricane Center to be catastrophic in the areas I needed to be. This is where we use our remote live cell tower capable streaming cams which worked perfectly in 2020 capturing storm surges in Sally & Delta. My home base for Ida was in Morgan City Louisiana which turned out to be beneficial and having power post landfall. I traveled to Houma, Louisiana where the town was expected to go underwater and the eye was forecast to hit. I set up my one cam to work with on this trip , the other cam never made it due to fedex not arriving in time. I found a row of mobile homes across from the Heliport in S.E Houma and decided to strap the remote cam I had to a pole along side the mobile homes. Not only was I expecting these homes to get destroyed but the surge was supposed to come up to about the height of the cam around 10ft.

My remote cam location as Hurricane Ida hit.

As it turned out the power pole I attached the cam to got blown over in the wind. As you can see in this video the 3rd mobile home from the camera which was blocked by the others got blown to pieces. Towards the end of the video I drive through the impacted areas showing the heavy damage.

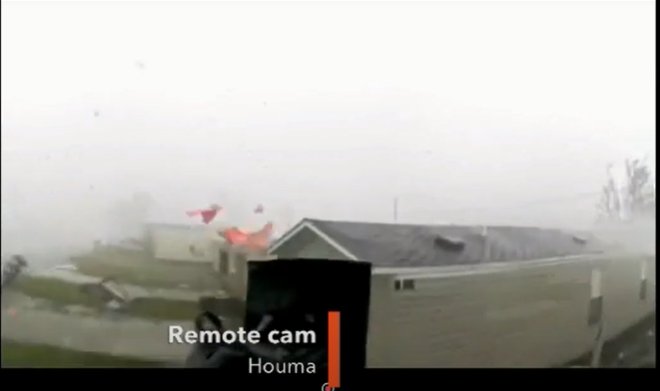
Half way through the hurricane warning show the remote cam captures the home being destroyed https://www.youtube.com/watch?v=qiOP2cPXscI

Each year following the season the National Hurricane Center will release final reports on each system. We won’t know how many died & total damage amounts for 2021 until sometime in the spring, but one thing for certain is that 2021 was quieter than 2020. Indications are for damage totals to exceed $60 billion dollars for all storms which is higher than last years total because of Ida damage. If you live in S.E Louisiana where Hurricane Ida hit, the season was devastating and it will take some of these areas years to recover. Where they go matters thank you for your support & I’ll see you next hurricane season which starts on June 1st. ..Jim Williams

2021 hurricane season landfall predictions

After a very active 2020 Atlantic hurricane season I see no reason that we should not see another very active season. I am calling for 20 to 24 named storms but not as many named storms impacting the U.S mainland coast as last year. My predictions for 2020 called for 18 to 20 named storms & we ended up with 30 but as far as landfall projections once again all of my top 5 were impacted. As I say every year

A city or island could be hit very hard that I do not predict, everyone in the basin should be prepared as if you are in my top 5.

In 2020 we saw several hurricanes impact Louisiana with late season Zeta hitting my #8 Grand Isle, LA as a major hurricane. My number 1 pick for 2020 was Cancun, Mexico impacted by Cristobal, Gamma, Delta & Zeta with 4 impacts I guess you could say that was pretty accurate.

So before each season usually starting in April I create this chart to place my top 20 locations. My top 20 are chosen from my list of 139 cities & Islands in the hurricanecity database. The top 20 are chosen based on being statistically due or overdue for a named storm. Other locations are chosen based on historically being hit in my chosen ENSO Analog years or based on trends.

Predictions chart

Now once the top 20 are graphed the pecking order is based on the number of columns each location wins based on the 8 criteria at the top. As you can see Wilmington, NC won the most with 3 highlighted boxes in yellow. One of the most important criteria columns is the NAO (North Atlantic Oscillation). Each year I keep track of the NAO in each hurricane season & mark it as either positive or negative at the NCDC NOAA site that keeps track which can be subjective considering some seasons can be half & half. The winner in that category was Wilmington with 41% of all hurricane seasons that they were impacted when there was a positive NAO which which will show up more than negative will this season. That was the highest percentage of all the cities in the top 20 that was calculated. To keep this post as short as possible I cannot get into the specifics on what the NAO can do to hurricane season but in a nut shell a positive NAO can lead to more ridging in the north Atlantic & less troughing.

Another important column on the chart above is what city got hit most in the past ENSO years that I think most closely match up going into this hurricane season. My ENSO analog years are based on being around Neutral at the height of the season plus matching what has happened the past several months. My matching years are 1956-1971-1974-1984-1985-1989-1995-1996-2001-2006-2008-2011-2012-2018-2020 a total of 11 used.

The other cities that did not win any columns were ranked based on whoever has the highest average number of named storms when they get impacted. Based on my prediction of 22 plus named storm the higher the average the higher that city or island is ranked. The method to this madness is more than simply making a circle on a map especially a large one like many do. If you draw a circle from the Carolinas to Maine that means like 80 million are left wondering so I like to narrow it down. So without further ado here is my top 20 for the 2021 Atlantic hurricane season.

#1)Wilmington, North Carolina
#2)Cayman Islands
#3)Belize
#4)Negril, Jamaica
#5)Homosassa,Florida
#6)Cedar Key, Florida
#7)Kingston, Jamaica
#8)Vero Beach, Florida
#9)Antigua
#10)Cape Cod, Massachusetts
#11)Eleuthera Island, Bahamas
#12)Steinhatchee, Florida
#13)Fort Lauderdale, Florida
#14)Savannah, Georgia
#15)Beaufort, South Carolina
#16)Bimini, Bahamas
#17)Dominica
#18)Martinique
#19)Tampico, Mexico
#20)Oviedo, Dominican Republic

As always I like to pick a track I think may happen and a few times my tracks have been almost identical to what ended up happening. For this year I have a real concern for the big bend, Florida area with a track across from the Gulf in to the Atlantic. Of course this will not be the only track & probably not the only impacts to land. All quadrants of the Atlantic basin will be in play it’s just that I feel this particular track could be big trouble.

Prediction track map

Any way that wraps it up thank you all again for the donations make your plans now and good luck this hurricane season.

hurricane season 2020 landfall predictions

By : Jim Williams May 18th,2020

As we approach another hurricane season all indications are that it will be a busy one. I am predicting between 18 and 20 named storms in the Atlantic basin. My city landfall predictions are based on calculations of 8 criteria mainly statistical with a couple of environmental such as ENSO analog years & the North Atlantic Oscillation. Below is a chart that I use every year before the season starts to calculate my top 20. I arrive at my top 20 cities & islands by using my eight criteria against every city in the database (140) with the areas making the cut by at least being in one of the boxes below.

As you can see the highlighted yellow boxes indicates #1 Cancun, Mexico has data in the most columns (5) of 8 and therefore wins. Then the real calculations begin for example 3 locations share 4 columns and those 3 have order determined by highest % in each column . Here is the list of what areas have the most columns 5)Cancun, Mexico (alone) 4)St Pierre,NF — Cayman Isl, — Manzanillo, Cuba . 3) Grand Isle,LA — Galveston,TX–Ocean city,MD — Miami,FL — Brownsville,TX 2) Oviedo,DR — ABC Isl –Morehead city,NC — Dauphin Isl,AL — Cabo Corrientes,CU — Norfolk,VA & Barbados 1) Kingston,JA –Myrtle bch,SC — NY,NY — Tampa,FL. Each grouping competes for highest % in each column for pecking order. Based on all my number crunching here is my top 20 #1) most vulnerable to #20)moderate.

#1)Cancun,Mexico
#2)Cayman Islands
#3)Manzanillo,Cuba
#4)St Pierre,Newfoundland
#5)Brownsville,Texas
#6)Ocean city,Maryland
#7)Miami,FL
#8)Grand Isle,Louisiana
#9)Galveston,Texas
#10)Aruba,Bonaire,Curacao
#11)Morehead city,North Carolina
#12)Norfolk,Virginia
#13)Cabo Corrientes, Cuba
#14)Oviedo,Dominican republic
#15)Barbados
#16)Dauphin isl,Alabama
#17)Kingston,Jamaica
#18)Myrtle beach,South Carolina
#19)New York,New York
#20)Tampa,Florida

Of course there will be far more tracks than the two above but I do expect quite a few re curvatures (systems turning north before hitting Bahamas). So to wrap things up my concern this season is for the Western Caribbean & possibly Texas with maybe a east coast rider coming up from the gulf. I must stress that if your city or island is not on this list do not let your guard down. In any given season anyone can be affected but if your in my top 5 batten down the hatches (be ready).

hurricane season predictions summary

As the 2019 Atlantic Hurricane Season comes to a close three things come to mind. Hurricane Dorian was the main story, many named storms do not always translate in to more impacts to land and what’s with all the cats 5s (2 more Dorian & Lorenzo 6 since 2016). The season ended with 18 named storms with the average since 1990 at 14 named storms would make this season seem busy.

2019 Atlantic hurricane season storm tracks

Had it not been for hurricane Dorian hitting the N.W Bahamas as a category 5 this season would have been considered a bust relative to the preseason hype. Of course Dorian did impact the outer banks of North Carolina with surge flooding but as a weakening system with the highest winds remaining offshore. Tropical Storm Imelda flooded out parts of the north Texas coastline & hurricane Barry impacted the S.E Central Louisiana coastline but with mainly tropical storm force winds. Not minimizing the impacts from these systems but the potential mass destruction & loss of life was simply not there for the U.S. There were others in the basin as well including 3 systems impacting the Azores islands in the N.E Atlantic but mainly minimal impacts. It was the islands of Great Abaco & Grand Bahama which had a high death toll with many still missing along with catastrophic damage that was THE STORY.

Wind swath in Bahamas from Hurricane Dorian

Of the 18 named storms in the Atlantic basin 8 impacted land with 40 mph plus winds which translates to 44% of named storms this season. Considering since 1990 that average is 57% makes this season well below normal for the amount of named storms to impact land. This leads to the assumption many including experts make that more activity translates to more landfalls but that’s not always the case. What is interesting is this map I created back in 2016 showing who gets impacted during certain numbers of named storms. Notice the 18 plus in red areas for the U.S were both impacted this season .

numbers of named storms when impacted

On June 1st of this year I made my annual hurricane season landfall predictions which was distributed to my list of people that donate to hurricanecity.com. Up until last year this list was made public which also included potential map tracks & a video explanation. More and more people were starting to pay attention with upwards of 20,000 views on the videos alone. Years ago I used to have a annual hurricane season kickoff show where I would announce my cities & islands to be impacted. As the years have passed and mainly due to social networking (free abundant info) donations have fallen flat at HC with many of the same people donating on an annual basis. For that reason I decided to only distribute this info to these people in a private email along with updates throughout the season. If you would like to donate & be added to the list please visit my donation page

As for my predictions this was by far my best season ever with not just my top 5 which I like to focus on but my top 9 were impacted. This is amazing considering only 44% of the storms this year impacted land well below the 57% average. After each season I update my predictions page so you can keep a running tab of what I said vs what actually happened. A few years ago on the James Spann show called weather brains I was asked by James “what are we supposed to do with this information?” I always say everyone should be ready but if you are in my top 5 there is a good chance you will be impacted spread the word.

Screen shot of 2019 predictions

On a final note my heart breaks for the residents of Great Abaco & Grand Bahama islands as it will take many years to get back to normal from hurricane Dorian. Nassau #2 dodged a bullet & Abaco #6 were warned maybe it’s about time more “experts” focused on landfalls & not numbers. Will we see more cat 5s in 2020? Please follow me on twitter thank you…..Jim Williams

Seeing eye to eye with Hurricane Michael

By: Jim Williams Oct,2018

I took an interest in hurricanes in the mid 1970s and since then have been in or near the core of 10 hurricanes in which half were major. Those were Hurricanes Andrew cat 5 to my south in 1992, Jeanne 2004 cat 3 just to my north I was in core, Matthew 2016 cat 3 just to my east in New Smyrna bch,FL in western eye wall , Irma 2017 cat 4-3 just to my S.W and Hurricane Michael this year where I was in the eye . On a side note hurricane Wilma 2005 passed right over my home with the eye passing over as a cat 2 after hitting S.W Fl as a cat 3. The reason for pointing these out is to let you know I have been in high winds before and that may have helped prepared me for what I was about to go through.

Since 1998 we have provided live hurricane coverage at hurricanecity.com for most major hurricanes hitting the Caribbean and for most other hurricanes hitting the U.S Mainland here is our list of video archives. We have always tried to show live webcams,chaser video,local news and stats as a hurricane is hitting. This process has become increasingly difficult as the years have passed due to copyright concerns, loss of internet streams, cams being taken offline and simply not very good reporting as hurricanes hit. Case in point the Weather Channel coverage consist’s of multiple reporters on scene with most if not all of them outside of the core of highest winds. They often show their main stars leaning in to the wind or getting blown over which can happen in category one conditions when the hurricane itself is major. Quite a few storm chasers used to participate in our coverage but have chosen to sell their video rather than share it live. This sets the stage for my intercept of Hurricane Michael in Panama City,Florida October 10th,2018.

Earlier this season Hurricane Florence was headed towards North Carolina and I wanted in the worst way to be there covering it as it moved onshore. I lost a close friend and had to attend her funeral the weekend prior to Florence hitting. The time left over would not have allowed me to set up properly in time to do an effective job covering Florence. At the time I thought “well usually (except for last year) there is one big one for the U.S (or none) and that is it” , but nearly one month later things would change as Hurricane Michael would head for the Florida panhandle.

Florence track
Michael track

So now that you know why I went in to the teeth of the tiger ,let me tell you what is was like the day before Michael hit. Oct 9th I traveled though Panacea,Apalachicola,Port Saint Joe & Mexico beach before settling in Callaway near Tyndall Air force base. At this time winds along the coast were brisk but probably not much over tropical storm force minimum of 40 mph. While passing through Apalachicola I noticed some small vessels and docks sunk beneath the rising tides. Traffic was light mainly outgoing but hwy 98 was passable late in the afternoon in both directions. It did not appear at this time that any homes were being inundated even if they were they were on stilts. My thoughts were NO–NO & NO for deployment to this area for Michael or any other storm as getting away from the surge would be problematic. Honestly the entire big bend Florida area scares the hell out of me when it comes to water inundation as low lying and vulnerable to huge surge. From just east of Panacea on Apalachee Bay all the way to my target area most homes were boarded up & people were getting out. Even fuel was scarce most stations with yellow caution tape on pumps as out of gas. I found one isolated gas station south of Panacea that still had fuel so I topped off the truck which ended up being my smartest decision the entire trip. As I was leaving Apalachicola it was as if I was saying goodbye to all of those structures along the coast but luckily most survived due to Michael making landfall further north. With a full tank of gas which is enough to get 300 miles I continued west towards Port Saint Joe. I had tentative plans to stay at the mainstay suites in Port St Joe but after viewing the property it appeared there were too many trees and the hotel was isolated from the downtown areas so I decided to head north. It turns out that the hotel had very little damage & many of the surrounding trees were left standing possibly due to Michael hitting further north.
1st option hotel

Each of these towns leading towards Panama City are separated by long stretches of wooded areas along hwy 98. As I entered Mexico beach from the south the tree canopy was suddenly absent with long stretches of exposed beaches. Small hotels & larger condos sprinkle the shoreline with restaurants,small stores & residential homes on the east side of hwy 98. Most structures on the coast looked well built even though they were mostly wood framed. Some condos looked to be CBS but again with a potential major hurricane on the way the place did not look safe at all. The few small hotels were not even an option as they were boarded up & wisely abandoned. If my truck were to survive, would I want to sleep in it for three days? NO. This ended up being ground zero right front quadrant of Hurricane Michael and every conceivable option for lodging ended up being destroyed. The town looked mostly abandoned a few people & cars driving around but very quiet. At the north end of Mexico Beach I was going to set my remote camera up on a canal facing the Gulf which in hind site would have been epic and could have caught the southern portion of the eye but retrieval would be difficult getting back in to this area from the north.

Potential mount of remote cam

After deciding Mexico beach was probably not going to be an option I headed further north through another stretch of woods several miles to reach Tyndall Air Force Base. Several large guarded entry ways for military personnel only stretch all the way north to the Dupont bridge leading in to Callaway. Again this area very quiet as the bases were probably left with skeleton crews. There are no hotels in this stretch of hwy 98 which forced me in to Callaway but not before I found a good position to mount the remote camera where I could retrieve it before leaving. Notice the photo below the bill board crashed to the ground & the condo roofs took a beating.

Remote cam location before
Remote cam location after

After driving north on Tyndall blvd it appeared the closest hotel to the coast was the Comfort Suites. I investigated several other hotels just to the north but they did not seem as sturdy as the comfort suites and I ended up being right as they sustained significant damage in comparison. The photo below shows surrounding heavy damage but the hotel lost just shingles, some windows and part of the front canopy. The striking thing to me was that no one seemed real concerned about was was coming,even the clerk at the front desk did not seem to be concerned. I asked about a generator,are the windows thick?, do you have a room on the second floor in case of flooding?, do you have a room facing north figuring at check in the winds would be mostly south & southwest all questions seemed awkward for her.

Comfort suites before Michael
Comfort suites damage after Michael

Eve of Hurricane Michael we broadcast live on Facebook and Periscope at 8:00PM warning of the danger that is coming. Starting from the beginning of the video the threat is clear even inland is in danger.

Surprisingly the morning of Michael the hotel still had it’s continental breakfast & room service was operating as if everything was normal. I took advantage of the breakfast but my stomach was in knots so I nibbled & grabbed some bananas to go. I work outdoors in harsh conditions year round and have trained myself not to eat too much food or drink too much water as it will come back to haunt you in extreme conditions as bathrooms are not an option. This was yet another good choice as food was scarce in the aftermath along with power or running water. I waited until just before noon for the core to arrive which is a tradition at hurricanecity.com for all hurricane landfalls no broadcast until the worst arrives. Before leaving I made one final call to my co host Bill Phillips questioning if I should head out at all considering we now have a borderline category 5 on our doorstep. We talked about maybe staying under the overhang in front of the hotel but after driving underneath realized the view was not very good. Furthermore the wind would have been pushing straight in on the overhang putting the truck at risk of loosing the front window as the winds would now be East and N.E rather than the anticipated southerly winds. I decided at that moment to head south on Tyndall blvd in order find an open lot to ride it out. Just about a half mile south of the hotel I find a parking lot with a Texaco station which believe it or not was already mangled from either strong straight line winds or a tornado. As the winds at this point were mainly out of the east probably cat one, I decided to face the Texaco station west with the back of the truck in to the wind to be shielded by my lexan protective glass.

Lexan glass shield

As time went by the barometric pressure was dropping like a rock and the winds were picking up gusting to 100mph. As the pressure dropped to around 940mb all hell broke loose with he winds accelerating in what I like to call jet airplane mode. Major hurricane force winds were buffeting the truck with debris slamming into the lexan glass & the back of the truck. This lasted for maybe 15 minutes but it seemed like an hour to me. At one point just before the eye arrives the winds are so strong no matter what direction I faced the air was filled with debris as if a tornado was hitting seen in short version below.

Meanwhile the remote camera on the east bay was getting annihilated . The clips in the videos speaks for the violent conditions the camera was enduring which operated through most of the storm. White out conditions pretty much prevented any real good video so next time it will be mounted closer to nearby objects.

worst conditions on remote cam

Finally the eye arrives and I get out to survey the damage est pressure 923mb as my last fix was 924.8 while still coming out of the eyewall. I was too involved with damage assessment to check it when the calmest period was over me so I used nearby chasers readings.
photo of hurricane michael eye
Radar of eye
The truck took a hard hit as the paint peeled off the rear bumper with several dings all over the truck but the worst was yet to come (eye survey below).

As the back side of Michael was approaching I decided to head further south to another open parking lot away from power lines,trees and poles as I knew the winds would be shifting out of the North. Just about every store front window protected by plywood was blown out and the worst was yet to come. As the winds shifted the truck was getting pelted with larger debris than before and shaking more violently. At one point a large children’s playground set was being pushed across the parking lot as the cinder block building to my north blew open pushing items out of the side of the building. Suddenly a large object hit the top of the truck ripping the light bar off & flung it in to the parking lot. At this point I lost my internet connection with Bill & the stream was lost as the worst conditions were upon me. This was a lonely feeling as the truck was getting nailed ,then it happened the lexan glass broke .

object that broke glass
Watch closely in the clip below as the object pictured above about the same size as the hole to the right is stuck against the lexan glass, this could have been the culprit.

Luckily our internet outage only lasted for 15 minutes and we were back on air. For another 15 minutes the winds were well over 100 mph as I continued positioning the truck backing in to the wind. Finally things calmed down & the pressure was rapidly rising as I slowly made my way around downed power lines, trees and power poles to get back to the remote camera. The further south I got towards the camera the more damage their was with more people needing help. You see my truck looks like a city vehicle so obviously people thought I was the first arrival of help. I had several conversations with people explaining injuries needing communications in which 911 was down at the time. People needed to know where shelters were I had limited information and don’t even get me started on how many homeless people were in this area before the hurricane. They all had stories to tell I mean as high as the water rose in that area I cannot even imagine where they escaped to. All I could tell them was that help is on the way as I would later find out huge convoys were headed in.

Altogether these were probably the most dangerous driving conditions I have ever been in as the truck clearance barely made it underneath hanging power lines. At times I had to travel through grass and muddy areas nearly getting stuck but finally made it to retrieve the camera. Upon arriving back at the hotel I noticed about a dozen windows blown out on the north side of the building but luckily my room window was intact. After surveying the hotel it appeared that no staff was present but the main lobby was leaking badly. People were wondering around like zombies taking in all the views of damage with disbelief. Obviously power was out but so was water I could not flush the toilet or run water out of the faucet “oh I am so glad I did not eat”. I did however turn the AC down to its coldest setting right before Michael hit which allowed the cool air to stay in the room so I could get a decent nights sleep. At least that was the plan but all I could hear all night was the sound of wind in my head like white noise replaying the worst of Hurricane Michael. Not to mention with no ACs running you hear every foot step & voice in the hall ways.

After tossing and turning all night I left the hotel around 9AM still no one at the front desk. The hotel looked like it was stuck in time with everything disheveled and people wondering around not knowing what to do or where to go. One woman frantically came up to the truck asking if I knew where any shelters were. She had a disabled child and two elderly people who needed medical attention. Thanks to my buddy Gregg Gibbs in emergency management as he was able to give me some addresses. As I headed north the view of the damage was tremendous with scenes like this Waffle house everywhere. Sadly most of the TV & radio stations were knocked off air. I could only find one AM and one FM station with hurricane information one of them simply looping a press conference, is this the best they can do? PEOPLE NEEDED INFO (FAILURE).
Waffle house destroyed in Michael
Taking 15th street north towards hwy 231 not one building did not have significant damage. Further north on hwy 231 a reported 139 train cars were flipped over due to the strong winds. As I traveled towards I-10 the damage was still noticeable then I come to find out I-10 is shut down due to tree removal. I decided to take hwy 90 east towards Tallahassee traveling through cities like Marianna where damage was extensive.

Damage in Marianna from Hurricane Michael
This turned out not to be a good decision as traffic was flowing so slow it was mostly at a complete stop. I got back on I-10 west of Tallahassee only to run in to more gridlock as road crews were clearing trees it was as if Michael was a gigantic weed eater through the forest.

Trees I-10 after Michael

It ended up taking me nearly all available daylight just to get to Tallahassee in which many were still without power. After getting back on the peninsula I tried getting a hotel room after being exhausted from driving . Every hotel I tried was booked with power crews,insurance adjusters,tree crews and first responders coming up from the south but finally found a room near Gainesville. All available help was needed so I was not disappointed but before I crashed for the night I stopped in for a bite to eat at the Waffle House. I showed the crew the photos of the Waffle house crushed in Callaway seen above and they seemed a bit surprised making me wonder if the word got out of how bad it really was in these hit areas. So after getting back to my home base Delray Beach I took my truck to Prospect Plastics & Terry’s Toppers to show them what happened and how this can be addressed. Below is what the truck looked like immediately after Hurricane Michael, even one of the running lights got destroyed.

Damage to truck from Hurricane Michael

They suggested thicker Lexan when I said “I thought this was unbreakable?” with shrugged shoulders they said “nothing is totally indestructible” so I upped the thickness to 3/8 from 1/4 anything thicker would yellow from the sun. New matching running lights were installed on both ends and the hole in the roof from the light bar was patched. They mounted the new lights on the backrack eliminating the roof of the truck from any future damage.

new lexan glass for truck
new lights for truck

Overall I would rate this as a successful intercept with some minor adjustments needed for the next hurricane. I will do my best next time to interact more with the audience on periscope and to at least respond to the questions people were asking. I may do more interviews with victims and show more close up damage. I will take more digital video in the eye to examine the structure of the clouds and movement. I will install an external Microphone to capture the sound of the wind which you could not hear that well on the live feeds. I feel bad for the people impacted by Hurricane Michael as it will take a long time to recover . It is quite different to take the hit & get out versus having to stay in the area & deal with one problem after the next for months if not years. If possible we’ll see you in the next one and I promise to do my best not to disappoint, please spread the word and donate if possible,this isn’t cheap.Please donate any amount helps Thank you…..Jim Williams

2018 landfall predictions for hurricanes and tropical storms

Every year heading towards the Atlantic Hurricane Season the hype begins about how active it will be. All of the usual experts hype how many, how strong/ace and give practically even odds for large stretches of coastline about where they will go. Most people do not understand that it does not have to be busy to be a very bad season and there is a difference in where hurricanes tend to go in busy seasons vs slow which none of these experts bother to explain. Since 1871 seasons averaging 15 or more named storms have a higher landfall rate in the S.W Caribbean and the northern Gulf with slower seasons east Gulf,S Texas & the N.E U.S. Now this is not always the case as last year proved but Vegas odds makers would go with the stats and be right more than wrong.

I used 8 criteria for making my landfall predictions in 2017 which were pretty good considering 3 of my top 5 were impacted and 9 of the remaining 15 were also impacted. The one factor which really caught my attention was the positive North Atlantic Oscillation prediction in April for 2017 in which Marathon,Florida has been impacted in eight seasons with that type of set up. If you think that is nonsense consider right behind Marathon were Antigua & Sarasota with 7 yrs each both hit by hurricanes. Hurricane Irma nearly hit Marathon my #3 pick dead on as a major hurricane causing heavy damage. Normally in a positive NAO cooler sea surface temperatures will exist in the mean development region of the Atlantic. However in 2017 this region was warm which allowed Irma,Jose & Maria to become very powerful hurricanes while approaching the Lesser Antilles more like a negative NAO. Once again this year indications are that we will see a positive NAO and we are already seeing cooler SST’s in the areas where those 3 hurricanes formed. The winner in this category is Antigua impacted 8 times in this type of set up. NAO description

Image provided by the OSS foundation

Another one of my criteria is analog ENSO years in which I have chosen 13 past years that either are starting out similar to where we are at now as far as east pac SST’s or based on what model projections from April 30th are calling for. These similar years are 1955,1958,1968,1979,1990,1996,2001,2003,2006,2008,2009,2012 and 2014. The winners in this category with 7 similar years when named storms affected them are Halifax, Isle of Pines, Sable Island and Wilmington. Close seconds were Myrtle bch & Cape Hatteras, the more I did my calculations the more tracks like 1996 were lining up as a possibility with an increased threat to the Mid Atlantic states.

Another factor are return rates & the one area that stands out is the western Caribbean which is not only way overdue for a named storm such as Cayman Islands 7 years and 3 years for a hurricane considering this area gets slammed on a regular basis. Another area overdue for a named storm is Bangor Maine WHAT? 6 years overdue & new to the database . Come on Jim these things never make it up there, wrong as both Hurricanes Edna 1954 and Gerda 1969 which almost hit as a major passed just east of Bangor. Also the area has been affect by 31 systems ranging from extratropical storms to hurricanes. Out of my top 20 locations 9 are overdue for a named storm and 13 are overdue for a hurricane.

Speaking of hurricanes another interesting stat is how many named storms during the season when each of my top 20 were hit since 1900. Considering I am calling for 11 to 13 named storms 9 locations fall within this range when they have been hit in the past.

An interesting development in this years city picks is that 6 of my chosen 20 were impacted last year which is unusual and also a reminder that return rates are not my only factor for picking my top 20. The reason for this is because many of the locations hit last year have some trends from the past to indicate a pattern such as being hit 3 years in a row on numerous occasions or being hit following a major hurricane several times. Before I even pick my top 20 I go through all 140 locations in the HC Database to find the most interesting patterns going back to 1871. One that stands out is Cape Hatteras,North Carolina which has been impacted the past 2 seasons. Believe it or not 11 times this area has been impacted 3 years in a row in various forms. Another stat that is kind of alarming is the Island of Antigua impacted by major hurricanes Irma & Maria has had the island hit the following year 4 times after double impacts which is why they are number 7 and proves it’s not all about return rates. Below is my chart showing the methodology with yellow areas highlighted as the winners in each category which weigh heavy in the top 5.

2018 prediction chart

#1) Sable Island,Nova Scotia (same as last year)
#2) Wilmington,North Carolina
#3) Myrtle Beach,South Carolina
#4) Cape Hatteras,North Carolina
#5) Isle Of Pines,Cuba
#6) Cayman Islands
#7) Antigua
#8) Great Abaco Island,Bahamas
#9) Halifax, Nova Scotia
#10) Marathon,Florida
#11) Negril,Jamaica
#12) Fort Walton Beach,Florida
#13) Exmore,Virginia (Delmarva peninsula)
#14) Ocean City,Maryland
#15) Sarasota,Florida
#16) Boston,Massachusetts
#17) Bermuda
#18) Bangor,Maine
#19) Kenedy,Texas
#20) Santo Domingo,Dominican Republic

Here is the map that I produce every year for fun,last years was almost dead on.

Possible tracks

As I always say every year there will be an area or areas that are impacted that I did not pick. One area that comes to mind is the East coast of Florida with no locations in my top 20 other than Marathon. The east coast of Florida has a pretty regular return rate so any year this area is vulnerable. Another area other than Fort Walton bch is the northern Gulf of Mexico which also gets hit frequently especially in busier seasons but the unknown is how busy it will be. What I am trying to say is even though you are not in my top 20 consider last year the north coast of Cuba hit not in my top 20 by Hurricane Irma. Some areas I did pick were not impacted such as Montego Bay,Jamaica & #1 Sable Isl Nova Scotia. In any year regardless of numbers anyone can get impacted but if you are in my top 5 considering nearly 3 out of my top 5 on average are impacted you may want to take this season very seriously. You can see my city predictions including my past predictions with plenty of useful forecast links. I also have a video explanation talking further about how I arrive at my top 20. here , preparation is the key,good luck this year.

seasonal landfall projections

Since 2003 just before or at the start of the Atlantic Hurricane season I release my city predictions with areas I feel have a high to moderate risk of being impacted. Once again this past 2017 Atlantic Hurricane Season I accurately predicted 3 of my top 5 locations to be impacted by a named storm or hurricane. Of the remaining 15 locations 12 were impacted ,11 of these locations were impacted by hurricanes. Even if I was not the one making these predictions I would sit up in my chair and pay very close attention. Since 2003 I have only had 2 seasons where none of my top 5 were impacted by a named storm,even in a couple of seasons of less than 14 named storms I have hit on at least 1 of my top 5. For example in 2009 we ended with 9 named storms I still had 2 of my top 5 impacted. The beauty of these predictions are that I use sometimes up to 8 different criteria to choose my top 20. For example this past season one of my criteria is ENSO (El Nino Southern Oscillation) in where model projections in April indicated a higher chance of a low to moderate El Nino (warm phase of the southern Oscillation) during the height of the hurricane season. I released my predictions on May 15th based on a weak El Nino which never happened but was also involved in only 2 of the 8 criteria. The other criteria had little to do with the amount of named storms rather return rates and environmental conditions such as the NAO (North Atlantic oscillation).

On September 10th Hurricane Irma hit the lower Florida keys with 130mph winds , my #3 pick this year was Marathon,Florida . This location made my top 5 for the 2017 season based on only 1 of my 8 criteria . Since 1990 Marathon has been impacted when there is an above average NAO in April an amazing 8 times, now i’m just a stats guy that will leave that science to the PHD experts. Marathon was also statistically 2 years overdue for a named storm and 10 years for a hurricane.

Prediction chart

Sometimes when viewing these predictions it can be just as useful to see who is not listed. Some very high hit locations that are impacted just about every other year such as Cape Hatteras and the N.W Bahamas were not chosen and had minimal impacts during the 2017 season. Some years there are hard hit areas that I do not pick but this year it was different. Even Ponce,Puerto Rico hit by Hurricane Maria was my #14 pick and those that have followed my predictions closely know I do not pick Puerto Rico locations very often. Gulf Shores,Alabama my #2 pick impacted by Hurricane Nate was chosen because they usually get hit in more active seasons and the chart above shows 13.66 named storms the closest to our final 17. I like using the variation of different criteria as sort of a fail safe scheme but honestly the most important factor are return rates. I do not pick Texas locations that frequently but this year I narrowed it down to Port O’Connor,Texas at #12 that was just missed dead on by Hurricane Harvey as it hit Aransas Pass with 130 mph winds.

end of season map

Predictions made on May 15th,2017 in white

These predictions are not perfect in fact my #1 pick has not been impacted since 2009. This years #1 pick was the tiny island well south of Nova Scotia called Sable Island. There were a couple of systems up that way but passed too far south of the island or became post tropical to be considered a brush. Had that been the only area impacted I would have kept my track record intact with minimal disruption to human lives which leads me to my final points. No doubt this has been a violent hurricane season for many with 3 major hurricane hits and I did rank the big three. There were hundreds of thousands of properties destroyed with lives turned upside down but in comparison with the amount of square miles impacted the total death toll was low. I would like to think that some people in the Florida Keys “may” have seen these predictions before the season started. The picture at the top is me at a Florida Keys seminar on hurricanes a few years ago and who knows maybe someone remembered to take a look at hurricanecity made the proper preparations including getting out. Maybe you can read my face in that picture thinking “you all are in deep shit” but make no mistake Irma was no where near the worse case scenario for the keys.Had Irma not tangled with Cuba the surge & wind destruction wold have surely taken more lives. I think about the tiny island of Barbuda left uninhabitable by Irma and my #8 pick Antigua narrowly missed by the core and how different things could be there if the core passed over. To wrap things up the main concern going in to next year is not how many named storms but “where will they go?” I will release my predictions for 2018 probably some time in late May so stay tuned for announcements. In the mean time I wish everyone impacted by these intense hurricanes the best in their recovery efforts and hope these areas are built more hurricane resistant………..Jim Williams

Ranking this years big three

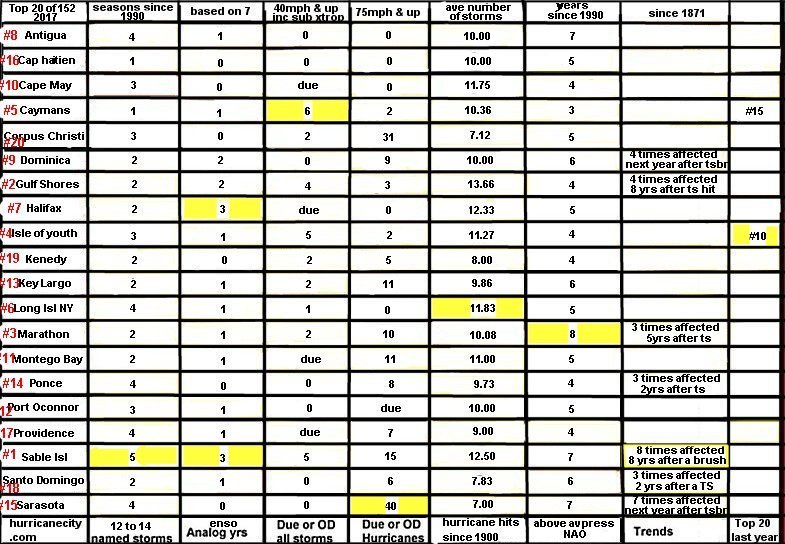
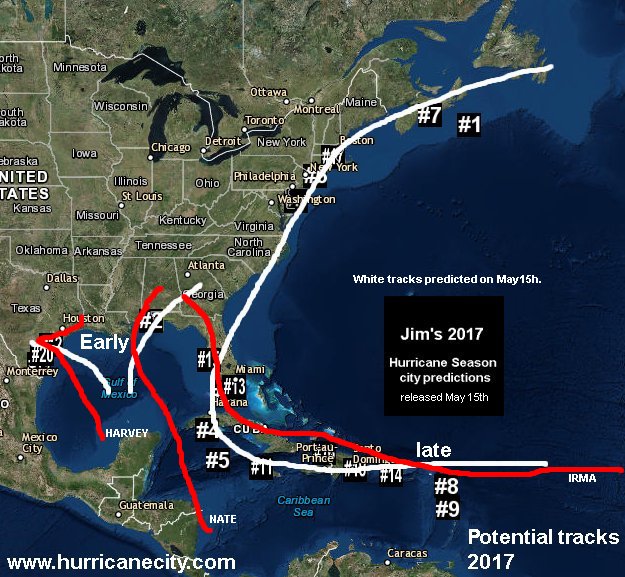
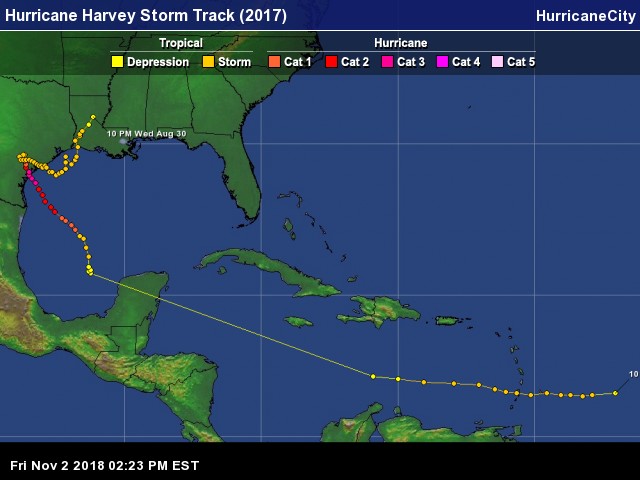
What a hurricane season it has been with three major hurricanes hitting land in the Atlantic basin starting with Harvey then Irma and finishing with Maria all within 27 days during the height of the season. Each Hurricane was devastating to the communities affected and it is extremely difficult to rank these three. Each impacted large areas,killed many and crippled infrastructures. Now what does rank mean? I will rank these three hurricanes based on impacts on human lives. I will give descriptions of each of the three hurricanes in order in which they developed (stats may not be exact as these are ongoing disasters). It all started with a tropical depression east of the Windward Islands on August 17th and like it’s predecessors early in the season struggled to survive due to unfavorable conditions aloft. The system weakened to an open wave in the central Caribbean, traveled west crossing the Yucatan Peninsula in the western Caribbean where if finally found a favorable position with low shear and very warm sea surface temperatures. On August 24th it developed into Tropical Storm Harvey in the Bay of Campeche and at this point the 2017 Atlantic Hurricane Season took a turn for the worst. In less than nine hours Harvey would become a hurricane setting the stage for several powerful hurricanes in less than a month.
Hurricane Harvey rapidly intensified to 130 mph as it made it’s way onshore just north Of Corpus Christi,Texas late on August 25th. The wind damage was extensive in Rockport and surrounding communities in Texas but this was just the beginning of what would be a deadly flooding situation in the Houston area over to Port Arthur,TX and western Louisiana. For the next five days Harvey would force nearly 40,000 residents from their homes after dumping over 50″ of rain in some locations as Harvey flooded over 100,000 homes. Costliest of big three est 180 Billion in damage

Track of Hurricane Harvey

Less than a week later Tropical Storm Irma forms west of the Cabo Verde Islands and once again becomes a hurricane in less than 24 hrs. On September 6th the eye of Hurricane Irma passed over the tiny island of Barbuda with 185mph winds causing complete devastation and leaving the island uninhabitable. Next up would be the islands of St Martin/Sint Maarten , Anguilla, Saint Barthelemy , St. Kitts and Nevis , St. Eustatius all with extremely heavy damage by the same 185mph winds. Next would be the Virgin Islands of St Thomas and St John 185mph direct hit same results with extreme damage. Irma would pass just north of Puerto Rico causing quite a bit of damage and left residents feeling like they dodged a bullet ,little did they know what was coming next. Hurricane Irma weakened slightly to 165mph while passing just north of Great Inagua Bahamas causing heavy damage but sparing the island of Irma’s worst winds. On September 9th Hurricane Irma raked 250 miles of the north coast of Cuba entering west of Nuevitas regaining cat 5 status and exiting well east of Havana with 120mph winds taking ten lives before turning towards the Florida Keys. On September 10th Hurricane Irma hit the lower keys with 130mph winds while turning NNW causing very heavy damage from Big Pine Key to Islamorada est one in three structures heavily damaged. That same evening of Sept 10th Irma made it’s final landfall in Naples with 110mph winds causing heavy damage to weaker structures such as mobile homes. Irma continued weakening while moving up Florida’s west coast causing hurricane force wind gust’s over nearly the entire peninsula causing the largest power outages in Florida’s history affecting over 6 million customers . Up in Georgia Tropical Storm Irma caused trees to topple and left of 1 Million without power. In South Carolina coastal flooding in some areas was worse than reported from Hurricane Matthew in 2016. Most intense winds of big three 185 mph in Barbuda,St Martin/Maarten,Anguilla,Saint Barthelemy,St. Kitts and Nevis , St. Eustatius,St John,St Thomas.

Hurricane Irma track

Once again less than a week later on September 16th a tropical depression formed east of the Lesser Antilles. Once again in less than 24 hrs hurricane Maria is born and within 48 hrs Maria becomes major. On the evening of September 18th Hurricane Maria hits the tiny island nation of Dominica with 160 mph winds a category five. The island was devastated and when all finished Maria left 27 dead. Next up would be the island of St Croix where Hurricane Maria was at it’s strongest with 175mph winds while passing just south. The damage here was reported as worse than what happened in 1989s Hurricane Hugo leaving the entire island without power. Next up would be Puerto Rico as Hurricane Maria approached from the S.E on Sept 20th with 155 mph winds and crossing the entire island as a major hurricane. The entire island was hit extremely hard knocking out the entire power structure and killing 51 although those numbers are in dispute ,some say up to 500 were killed. As of this post this outage has caused a loss of 2.5 billion hours of electricity supply making it the largest black out in U.S History. Lowest pressure of the big three upon passage St Croix 910 MB.

Hurricane Maria track

So now that we have a general idea of what happened in these affected areas let me state that there are not enough words to adequately describe how much these three hurricanes impacted peoples lives. The common sense answer would be all three are equal in how bad they were, but for arguments sake I will take a shot at which was the worst.

Big three styatistics

Stats above based on latest news reports from numerous news and government sources.


#1 worst Even though Hurricane Irma scored the most highs amongst the three according to the chart above I cannot escape the thought of having the majority of the power grid off line for nearly 2 months as is the case in Puerto Rico from Hurricane Maria. Dominica and St Croix also have gone for an extended period of time with limited electricty or potable water. All three of these areas will be lucky if the vast majority of residents have all services back up by Christmas. Even cell connectivity is limited in many areas,talk about frustration. Based on between 700,000 & 800,000 housing units not having basic needs makes Hurricane Maria the worst.


2nd worst Maria was known mainly for wind destruction but Hurricane Harvey was known more for flooding in so many areas it’s hard to imagine. Harvey was also a wind machine at landfall in Texas destroying many structures. Harvey took 84 lives mainly due to flooding after it lost hurricane status. Up to 15,500 homes were destroyed with estimates of over 200,000 damaged in the entire impacted area from South Texas to Louisiana. Even though less people were impacted by Hurricane Harvey than Irma the amount of time people have had to deal with re construction and mental anguish puts Hurricane harvey at #2.


3rd worst Even though Hurricane Irma impacted more people probably than the other two combined you can only look at the amount of time the majority of the over 25 million had utilities. The majority of outages in Florida were restored within 1 week and the total 8.7 million that lost power in the S.E United States was 99% restored within 14 days. There were some outages with cell towers but within a week most of that was restored. There was heavy damage in the Florida Keys but they are far better off than the Maria stricken areas. Unfortunately areas of Cuba,Virgin Islands (also impacted by Maria) and the N.E Lesser Antilles especially the island of Barbuda may take years to recover but population wise much less than Maria. Had the peninsula of Florida been hit by the same Irma that hit Cuba and the Lesser Antilles it probably would have been #1.

City predictions for the 2017 Atlantic hurricane season

Lower number of named storms, new forecast techniques added & cities more spread out than last year.

According to model data it appears we will have weak elnino conditions in the East Pacific at the height of or later in the Atlantic hurricane season. So what does this mean? a chance of increased wind shear across parts of the Atlantic basin approaching the height of the season Sept 10th. Tropical systems like to develop when calmer conditions are present in the upper levels of the atmosphere. Most development in the Atlantic occurs between August and the end of October when conditions are ripe but it could be different this year. As of just before this post the water temps in the enso region have somewhat cooled but this could have been caused by a temporary shift in trade winds and I still think deep into the hurricane season these SSTs will increase to near or at weak Elnino conditions.


International research institute for climate and society

For an elnino event to be established there needs to be a three month period of 0.5 degrees or greater SST’s in the nino 3.4 region and most models show this happening. This is a strong feature in my eight criteria put into my city predictions based on how many named storms there could end up being. This year I am calling for 12 to 14 named storms, last year I was calling for 14 to 16 named storms and we ended up with 15 named storms in the basin. As a result there will be practically a whole new set of cities chosen to be impacted by a named storm for this year with a couple of leftovers from last season. As for elnino comparisons I researched past seasons with similar SST temperatures in the East Pacific and was able to subjectively choose seven past years that come close to lining up with what the models are projecting listed below.
Elnino Analog years
Climate Prediction Center

METHODOLOGY

So now that you know my main factors for making my city predictions I need to make it clear that one or more of my top 20 may not meet the criteria above. There are several other methods used in arriving at my final list and sometimes these change from year to year depending on each methods success. This years list of methods not necessarily listed in the order of importance below.

  • 12 to 14 named storms finding similar seasons since 1990, were any of my top 20 locations affected in seasons like this? most of top 20 decided based on this criteria,leaning lower towards 12. As of mid May wind shear is screaming across the western Atlantic basin so I think we could get off to a slow start.
  • ENSO (Elnino Southern Oscillation) Comparing past seasons East Pacific sea surface temperatures to what model expectations show for hurricane season. What cities in my top 20 were impacted during these analog years.
  • Cities most due or overdue for all named storms based on av return rates from 1871.
  • Cities most due or overdue for hurricanes only (74 mph & up) av since 1871.
  • Average number of storms when these top 20 locations were directly hit by a hurricane since 1900.
  • NAO North Atlantic Oscillation based on expected positive stage causing higher trade winds & cooler north Atlantic SST’s. Since 1990 what cities were affected in a positive phase based on April stats.
  • Trends Criteria a similar event happening 3 or more times since 1871,(example) A hurricane hit a particular city in 2016 did the city get hit the following year in a similar way?
  • Were any of these top 20 in the top 20 last year? what ranking & for what reason.

  • Introducing the NAO “North Atlantic Oscillation” into my city predictions. For the first 12 years my city predictions were based on mainly return rates & statistical averages. My track record during this period was very good considering I averaged 2 or more of my top 5 cities impacted each season or 10 for 12 with the other two seasons having one/zero cities impacted out of a potential 152. Since introducing ENSO I have zero in 2014 and one in 2015 of my top 5 and just under 50% of the remaining top 20,so adding another factor such as the NAO may make things worse. Needless to say I am not pleased about adding these predictors as the statistical rates have served the process just fine. Continued questions from academia & pros about past statistics not being reliable enough has forced me in to uncharted territory but may be short lived if it does not add value. Using a starting point of 1990 I see if any of my top 20 were impacted in a plus year.

    Using the chart below each location is calculated and the highest amount in each category wins (highlighted in yellow) there are no tie breakers so more than one may be highlighted in each category. My top five picks are the winners with the most yellow boxes, in tie situations weight is put on the significance of each criteria. Fourteen of the locations had no yellow boxes but the closer numbers to the top five locations get the nod in the positioning. Due to the uncertainty of the NAO criteria it is given very low value in positioning.


  • #1)Sable Island,Nova Scotia
  • #2)Gulf Shores,Alabama
  • #3)Marathon,Florida
  • #4)Isle Of Youth,Cuba
  • #5)Cayman Islands
  • #6)Long Island,New York
  • #7)Halifax,Nova Scotia
  • #8)Antigua
  • #9)Dominica
  • #10)Cape May,New Jersey
  • #11)Montego Bay,Jamaica
  • #12)Port Oconnor,Texas
  • #13)Key Largo,Florida
  • #14)Ponce,Puerto Rico
  • #15)Sarasota,Florida
  • #16)Cap Haitien,Haiti
  • #17)Providence,Rhode Island(entire state)
  • #18)Santo Domingo,Dominican Republic
  • #19)Kenedy,Texas
  • #20)Corpus Christi,Texas

  • Each & every year there will be one or more locations affected that I did not pick. My past track record would indicate if you are in my top 20 you statistically have an increased chance for a named storm. If you are in the top five there is a pretty good chance 2 or more locations will be impacted. Last year for example 9 of 20 were impacted by a named storm, not bad considering I am plucking from 152 locations across the Atlantic basin. If you were told you had a 50% chance of being struck by a vehicle at a certain location you would look not just twice maybe three or four times. There is no harm in preparing for hurricane season regardless of your city on this list or not better safe than sorry. It is advisable to know your evacuation & flood zones,know where you will evacuate to and how you will get there,do they take pets?. As time goes by I will be adding my past years predictions notes and verification of what worked or did not work since 2003. This information will be added to my predictions page at Jim’s Predictions where you will also find maps & videos of my predictions. Thank you for your time and good luck this hurricane season.