Since 2003 I have been making city predictions before the season starts for what cities and islands I think will be affected during the Atlantic hurricane season which runs from June 1st through November 30th. I use a simple mathematical formula to calculate which locations are at a high threat or moderate threat by using past data going back to the late 1800s. There are several factors involved with making my picks so let me go over a few of them so you have a better understanding of my process. I usually wait until late April to start my calculations so that I have a good understanding of the upcoming environment for the season. The cities chosen are pulled from the 139 locations in the
. Below is the list of methods used (not in any particular order),so whatever cities match the most methods are at the top of the list.
Expected number of named storms, Trends since 1871, Statistically due or overdue for named storm, Statistically due for a hurricane, Positive or negative North Atlantic Oscillation during the season, Enso analog years trends matching what is currently going on. This method has been proven successful averaging nearly 3 of the top 5 cities each year with the only years with no top 5 impacted being 2013 & 2014. Also keep in mind recent previous years top 5 picks such as 2016 Panama city at #2 hit by cat 5 Michael in 2018, sometimes there will be a couple of years lag time.
I have decided to take a shot at predictions for the 2023 Atlantic hurricane season. This is not my usual detailed break down which usually has 7 different criteria due recent health issues.
2022 top 5: No Predictions done in 2022
2021 top 5:
2020 top 5:
#1) Cancun, Mexico (TS Cristobal, TS Gamma, Delta, Zeta brush),
#2) Cayman Islands (TS Laura brush, TS Eta)
#3) Manzanillo, Cuba (TS Laura),
#4) St Pierre, Newfoundland (xtropst Teddy),
#5) Brownsville, Texas (Hurricane Hanna brush)
Blog post about predictions |
Map of potential tracks |
Video explanation 2020
Very high threat 5 of 5 av miles from center 55, All 17 of 20- 85%, Predicted 18 to 20 named storms ended with 30.
2019 top 5:
#1) Bermuda (Hurricane Humberto),
#2) Nassau, Bahamas (0),
#3) Fernandina Beach, Florida (Hurricane Dorian brush),
#4) Wilmington, North Carolina (Hurricane Dorian brush),
#5) Grand Isle, Louisiana (TS Barry)
No video or Blog was done in 2019.
Very high threat 4 of top 5 av miles from center 61, All 9 of 20=45%, predicted 13 to 15 named storms ended with 18.
2018 top 5:
#1) Sable Island, Nova Scotia (TS Chris),
#2) Wilmington, North Carolina (Hurricane Florence, TS Michael brush),
#3) Myrtle Beach, South Carolina(ts Florence, TS Michael brush),
#4) Cape Hatteras, North carolina (Hurricane Florence brush, TS Michael brush),
#5) Isle of Youth, Cuba (subts Alberto & Hurricane Michael brush) (0)
Blog post about predictions |
Map of potential tracks |
Video explanation 2018
Very high threat 5 of top 5 av miles from center 49, All 9 of 20=45%, predicted 11 to 13 named storms ended with 15.
2017 top 5:
#1) Sable Island, Nova Scotia (0),
#2) Gulf Shores, Alabama (Hurricane Nate brush),
#3) Marathon, Florida (Hurricane Irma),
#4) Isle of Youth, Cuba (TS Philippe brush),
#5) Cayman Islands (0)
Blog post about predictions |
Map of potential tracks |
Very high threat 3 of top 5 ,Av miles from center 36, All 12 of 20=60% predicted 12 to 14 named storms ended with 17.
2016 top 5:
#1) Fort Walton Beach, Florida (0),
#2) Panama City, Florida (0),
#3) Great Abaco Island, Bahamas (Hurricane Matthew brush),
#4) Key West, Florida (0),
#5) Cape Hatteras, North Carolina (TS Hermine, Hurricane Matthew brush)
Blog post about predictions |
Map of potential tracks |
2016 archive
Very high threat 2 of top 5 ,av miles from center 44, All 9 of 20=45% predicted 14 to 16 named storms ended with 15.
2015 top 5:
#1) Port Charlotte, Florida to Naples, Florida (0),
#2) Panama City, Florida (0),
#3) Key West, Florida (0),
#4) Morgan City, Louisiana (0),
#5) Matagorda, Texas (TS Bill)
2015 archive |
NHC 2015 hit map |
Map highlighting threat areas. |
Video explanation 2015
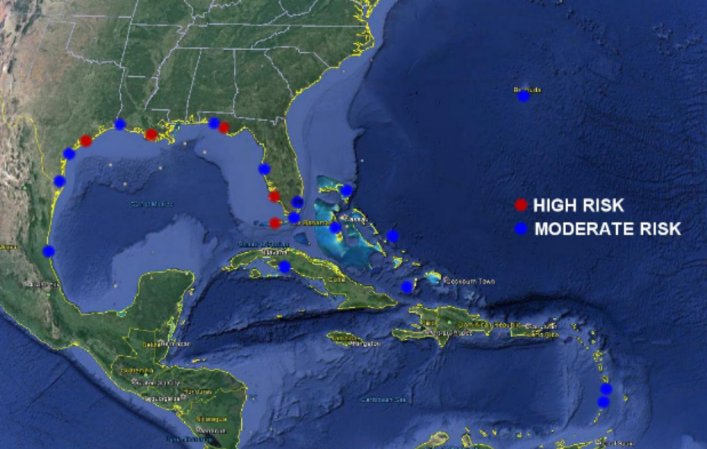
Very high threat 1 of 5 20% ,av miles from center 0, all 3 of 20= 15% predicted 9 to 11 named storms,season ended with 11. First year using my own Elnino Analog years.
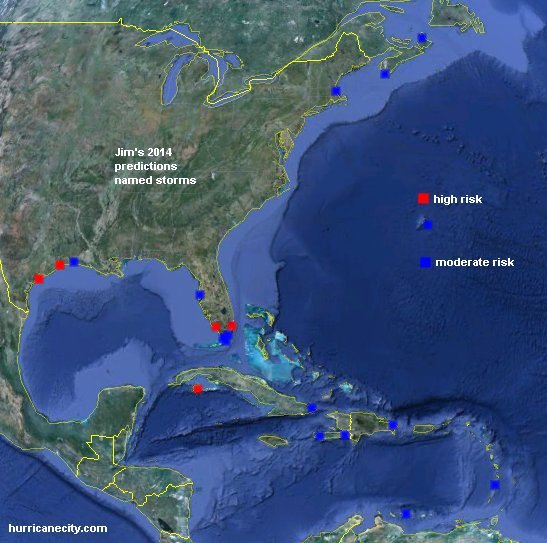
2014 top 5:
#1) Matagorda, Texas (0),
#2) Galveston, Texas (0),
#3) Naples, Florida (0),
#4) Miami, Florida (0),
#5) Isle of Youth, Cuba (0)
2014 archive |
NHC 2014 hit map |
Map highlighting threat areas. |
Video explanation 2014
None of top 5 impacted, all 3 of 20= 15%,ended with 8 storms
2013 top 5:
#1) Pascagoula, Mississippi (0),
#2) Fort Walton Beach, Florida (0),
#3) Vero Beach, Florida (0),
#4) Great Exuma Island, Bahamas (0),
#5) Boynton Beach, Florida (0)
2013 archive |
NHC 2013 hit map |
Map highlighting threat areas. |
Video explanation 2013
None of top 20 impacted, ended with 14 named storms, a terrible prediction year. This was my first year using ENSO as a factor based on Dr Gray's number of named storms.
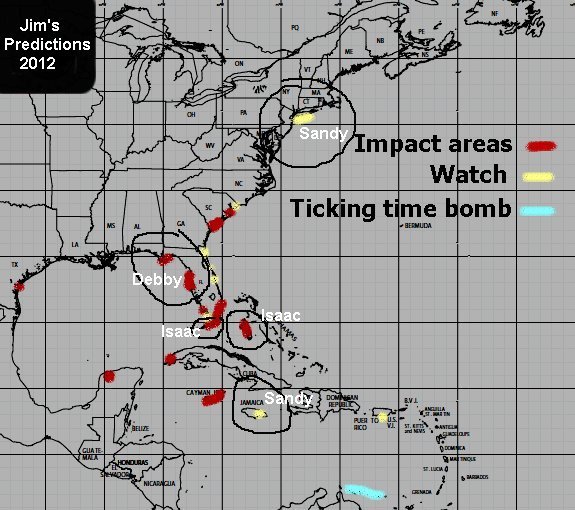
2012 top 5:
#1) Cabo Corrientes, Cuba (western tip) (0),
#2) Beaufort, South Carolina (0),
#3) Key Largo, Florida (TS Isaac brush),
#4) Spring Hill, Florida (TS Debby brush),
#5) Merida, Mexico (0)
2012 archive |
NHC 2012 hit map |
Map highlighting threat areas
3 of top 5 very high threat,av miles from center 74, 60% All 9 of 20 =45% based on 11 to 13 named storms ended with 19.
2011 top 5:
#1) Boca Raton, Florida (0),
#2) Grand Bahama Island, Bahamas (Irene),
#3) Boynton Beach, Florida (0),
#4) Great Exuma Island, Bahamas (Irene),
#5) Belize (Harvey)
2011 archive |
NHC 2011 hit map
3 of top 5 very high threat 60%, av miles from center 18, All 6 of 20 =30% based on 11 to 14 named storms ended with 19.
2010 top 5:
#1) Vero Beach, Florida (0),
#2) Fort Walton Beach, Florida (0),
#3) Fort Lauderdale, Florida (Bonnie),
#4) Pascagoula, Mississippi (0),
#5) Boynton Beach, Florida (0)
2010 archive |
NHC 2010 hit map
1 of top 5 impacted 20% , av miles from center 42, all 6 of 20 impacted 30% based on 13 to 15 named storms ended with 19.
2009 top 5:
#1) Grand Bahama, Bahamas (0),
#2) Cancun, Mexico (0),
#3) Bluefields, Nicaragua (Ida),
#4) Fort Lauderdale, Florida (0),
#5) Pascagoula, Mississippi (Ida)
2009 archive |
NHC 2009 hit map
3 of top 5 very high impacted 60%, av miles from center 34, All 8 of 20 =40% based on 13 to 14 named storms ended with 9.
2008 top 7:
#1) Saint Martin (Omar),
#2) Antigua / Guadeloupe (0),
#3) Grand Bahama Island, Bahamas (0),
#4) Destin, Florida (0),
#5) Vero Beach, Florida to Lake Worth, Florida (Fay),
Ticking time bomb = Morgan City, Louisiana (Gustav)
2008 archive |
NHC 2008 hit map
5 of top 7 very high threat impacted 71.43% All 12 of 20= 60% forecast 14 or more named storms ended with 16.
2007 top 7:
#1) Elizabeth City, North Carolina (Gabrielle),
#2) Belize (Dean),
#3) Bluefields Nicaragua (0),
#4) Antigua (0),
#5) Martinique (Dean)
2007 archive |
NHC hit map
4 of top 7 very high risk 57.14% All 6 of 20 =30% based on 12 to 13 named storms ended with 15.
2006 top 5:
#1) Vero Beach, Florida (Ernesto),
#2) Pascagoula, Mississippi (0),
#3) Sable Island, Nova Scotia (0),
#4) Mobile, Alabama (0),
#5) Cape Hatteras, North Carolina (0)
2006 archive |
NHC 2006 hit map
2 of top 5 impacted 8 of 20 =40%. Based on 14 or more named storms ended with 10.
2005 top 7:
#1) Punta Allen, Mexico (Emily),
#2) Gulfport, Mississippi (Katrina),
#3) Pascagoula, Mississippi (Katrina),
#4) Vero Beach, Florida (0),
#5) Biloxi, Mississippi (Katrina)
.... "notice the Mississippi heavy leaning"
2005 archive |
NHC hit map 2005
4 of 7 very high threat 57.14% All 13 of 20= 65% based on an active season,ended with 28.
2004 top 6:
#1) Fort Walton Beach, Florida / Pensacola, Florida (Ivan),
#2) Cape Hatteras, North Carolina (Gaston),
#3) Acklins Island, Bahamas (Frances),
#4) Cozumel, Mexico (0),
#5) Cabo Corrientes, Cuba (Ivan)
2004 archive |
2004 NHC hit map
4 of top 6 impacted 66.67% All 5 of 13 38.47% based on 14 or more named storms ended with 15.
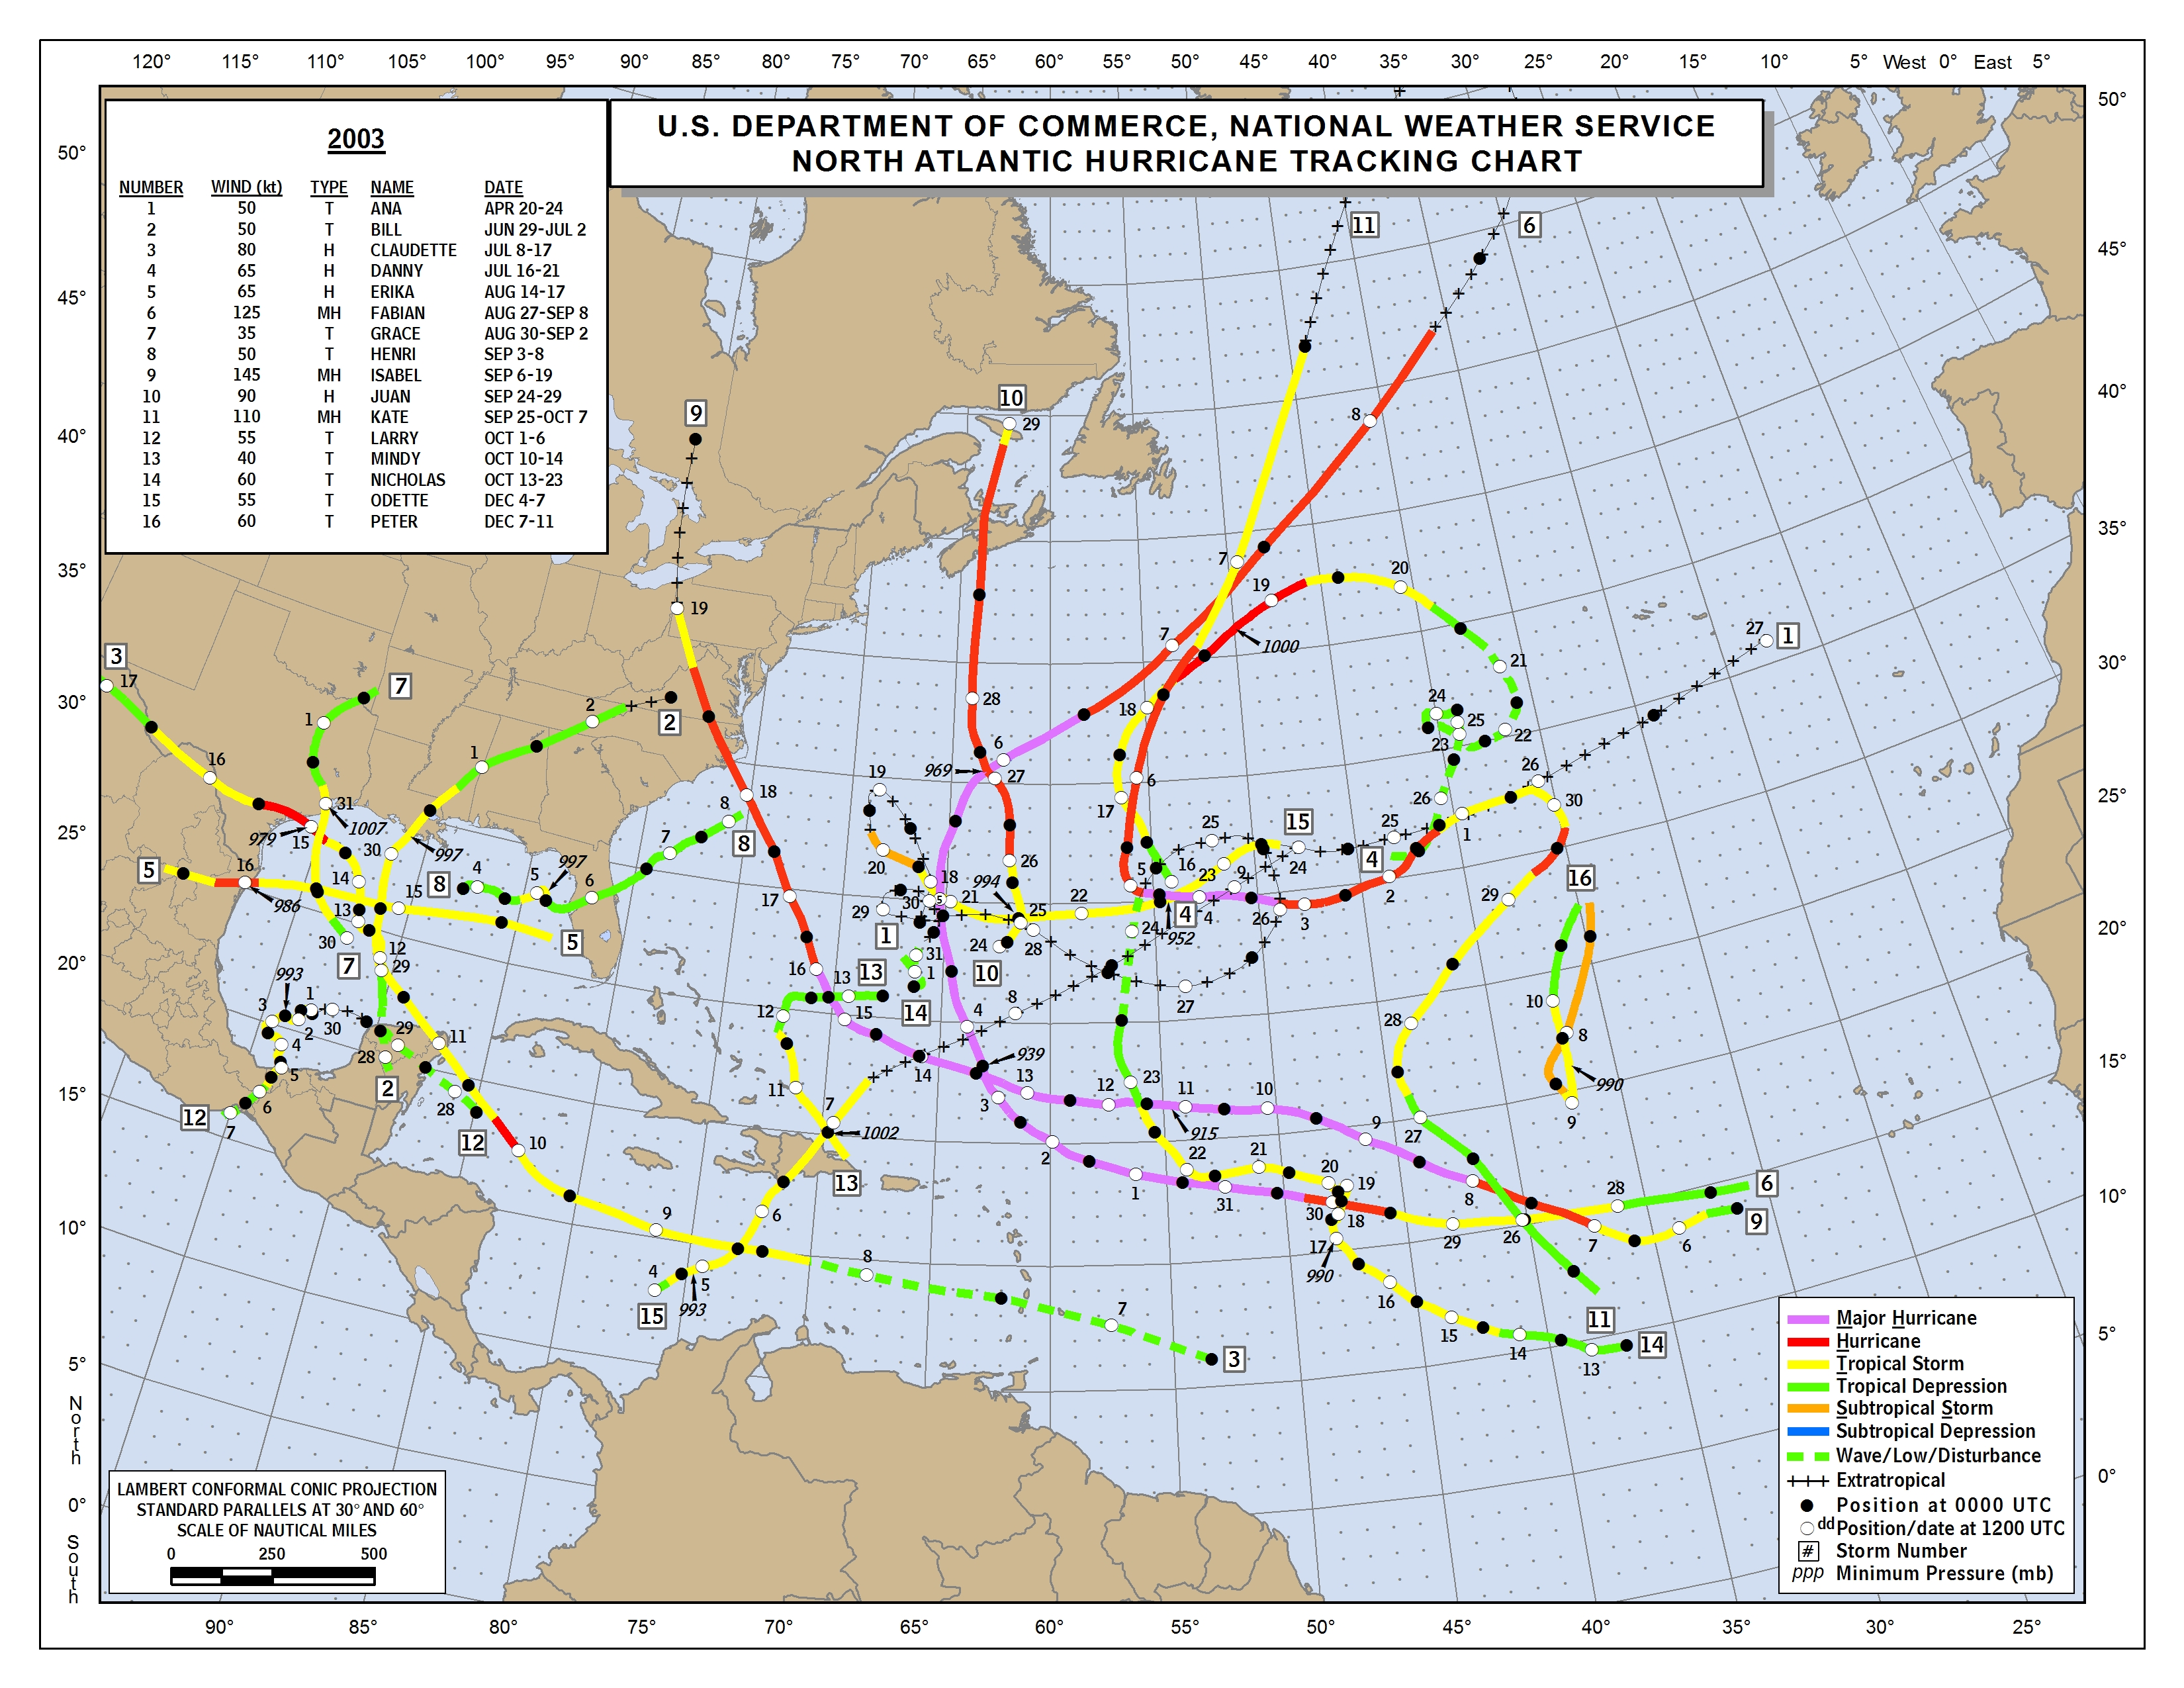
2003 top 10: very high / high threat
#1) Halifax, Nova Scotia (Juan),
#2) Cozumel, Mexico (overdue mention, Claudette),
#3) Brownsville, Texas (Erika),
#4) Belize City, Belize (0),
#5) Elizabeth City, North Carolina (Isabel)
Archive from 2003 predictions |
NHC map of hits
4 of top 15 very high threat 26.67% total impacted 14.63% of 41 picks ended with 16 named storms
Average top 5: 54% or roughly near three of top five cities on average.
All 20 city picks since 2003: 45%.


