How to Use Hurricane Maps
Products linked from HurricaneCity and seen on the tropical update videos can be confusing. On this page we show you what the maps' uses are for tracking hurricanes. Each thumbnail image on this page is only an example image. However, you can click on each image for the latest conditions.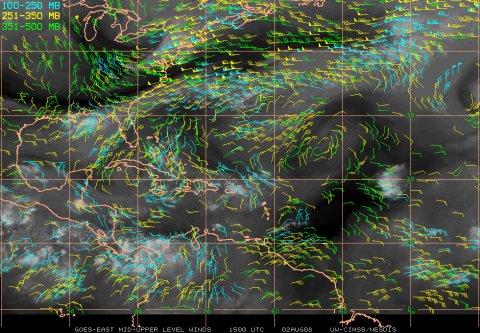
Upper Level WV/IR
This product from CIMSS helps to determine current atmospheric conditions that could affect TC intensity and movement using Atmospheric Motion Vectors. AMVs have been shown to have a significant positive impact on the accuracies of numerical models (Soden et al., 2001 and Goerss et al., 1998). 100-250MB level (aqua) = 50,000 to 35,000 ft, 251-350MB = 34,000ft to 26,500ft, 351-500MB = 26,600ft to 18,000ft. 950MB or lower would represent the surface winds below 1500 ft. The more lines on each arrow the stronger the winds. Maps like this are great for figuring out the strength of upper level winds that can harm tropical systems. In this picture to the left a tropical wave is approaching an upper level low northeast of the Antilles but upper level winds are not that strong. The darker areas indicate drier air while the grayer areas are more moisture. Click here for more info on this product.

Deep-Layer Wind Shear
This next image is the Atmospheric Shear map. The contours (yellow) show the vector magnitude shear (absolute value). The streamlines (pink) indicate the direction of the shear. This map is useful for figuring out the direction of the wind shear & what may be causing it. Many times when we see a well established hurricane, you will notice pink streamlines in a clockwise fashion directly on top of the Hurricane. This is a high pressure aloft which aids in outflow of developing hurricanes. Shear values below 10 m/s (20 kts) are considered low enough for tropical cyclogenesis. More here.
Upper Divergence
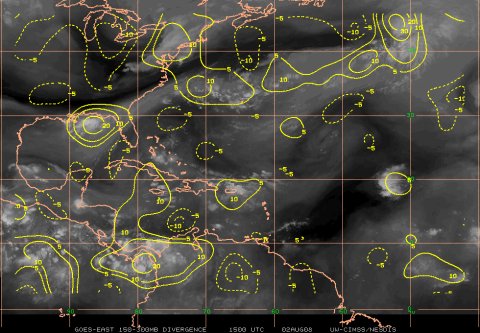
This Upper-Level Atmospheric Divergence map can be used to see if air is evacuating in the upper levels. Often times a weak tropical system will have divergence off to the left or right of the surface circulation. This shows you that the system is not vertically stacked but regardless of this, the stronger the divergence the better chance a system has to develop. In the plots positive divergence values are shown with solid lines, negative values (convergence) are shown with dashed lines. Notice in the image to the left a Gulf disturbance has good divergence aloft and could develop. More here.
Lower Convergence
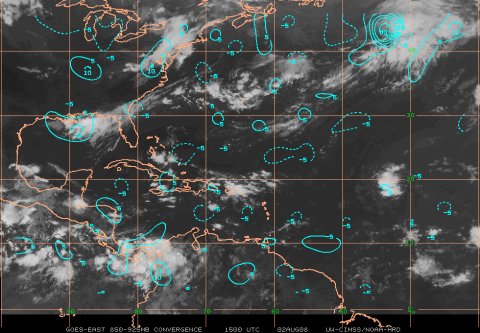
This map is the Lower-Level Atmospheric Convergence and can be used to identify potential areas where TC development may occur. This map focuses on the inflow at the low levels and helps to determine where a circulation actually is or is forming. This map along with the one above shows inflow of the Gulf system is slightly southwest of the divergence showing strong convergence and divergence but not a perfect setup. In the plots positive convergence values are shown with solid lines, negative values (divergence) are shown with dashed lines. More here.
24hr Shear Tendency
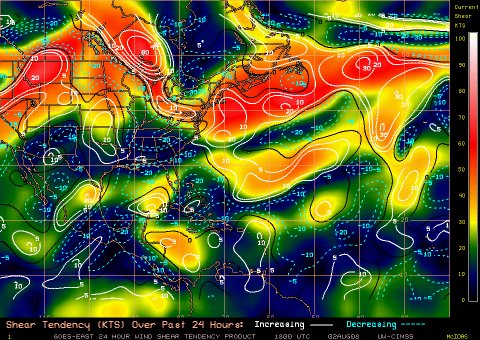
This is the 24-hour Atmospheric Shear Tendency map which is very useful in determining increasing or decreasing shear. The current upper level shear is shown with the colored background contours. Tropical systems need low or decreasing shear to develop because high shear as indicated in orange blows the tops off of the developing thunderstorms. The white lines indicate increasing shear and the aqua dashed lines indicate decreasing shear. The gulf system is under decreasing shear and should be favorable for development. The Atlantic system is under decreasing shear but still shows high shear values. More here.
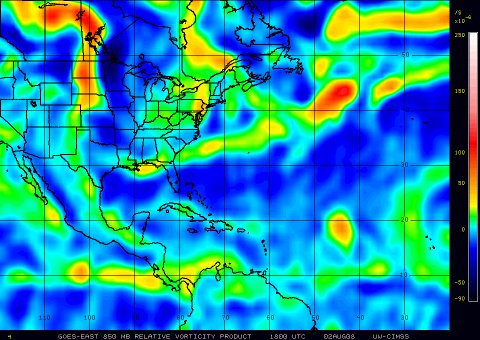
850mb Vorticity
Here is the Atmospheric Vorticity map which is a measure of curvature in atmospheric flow. The brighter orange colors as seen in the mid Atlantic indicates the environment is conducive to storm development. More here.
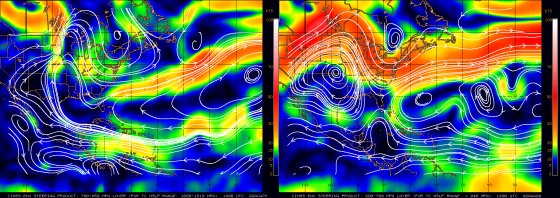
Layer Mean Wind
Here are two steering flow maps showing the direction a hurricane would move depending on the strength of the system. The map to the left indicates the flow of a weak tropical storm steered by the lower level winds. The white directional arrows indicate the movement the storm should take. The image to the right indicates a strong hurricane steered by winds in higher levels showing a tendency to move more west-northwest rather than west using the system in the mid Atlantic. (The map to the left links to the 700-850mb layer but the page has the other layers available at the top.) More here.
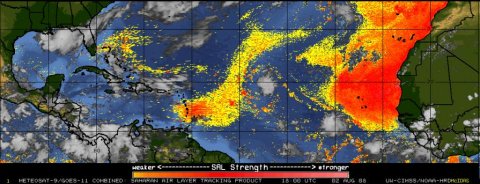
Saharan Air Layer (SAL)
The Saharan Air Layer map is very useful for monitoring the position and movement of dry air masses. Dry air can often times prohibit a system from developing even when upper level winds are favorable. This page has some great animations of past hurricanes showing how they struggled until exiting the SAL. More here on how this product is created. If the Meteosat / GOES-West imagery is not available, click here for a Meteosat only version.

Sea Surface Temperatures
Here is the Atlantic sea surface temperature (SST) map. Tropical systems need warm ocean temperatures of 80°F or above to develop and strengthen. Sometimes systems can develop in sub 80 degree water temps but it does not happen very often. The warmer the sea surface temperatures are, the stronger a system can get if it is in a favorable environment.
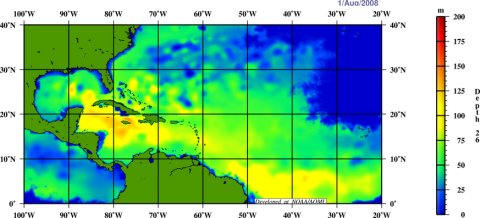
Depth of the 26°C Isotherm
This image is called the "Depth 26°C Isotherm" which shows the depth of waters 78.8°F. The legend on the side shows the depth of these warm waters in meters. During Hurricane Katrina in 2005 these warm water temps were over 100ft deep west of Florida. If a slow moving hurricane churns up these waters it will only bring up more warm water to fuel the hurricane. Here is a good page explaining how this affected past hurricanes.