yellow=current year 40+mph , br=brush, ts=tropical storm, bd= back door coming from opposite direction from over land.
2025 predictions released on May 15th
2025 Predictions:
#1) Norfolk, Virginia,
#2) Nassau, Bahamas,(TS Imelda 13m) ...
#3) Pensacola, Florida,
#4) Bimini, Bahamas,
#5) St. Augustine, Florida,
#6) Ponce, Puerto Rico,
#7) Cat Island, Bahamas,(TS Imelda br 78m)...
#8) New Orleans, Louisiana,
#9) Mole St. Nicolas, Haiti,
#10) Andros Island, Bahamas,
#11) Elizabeth City, North Carolina,
#12) Morehead City, North Carolina,
#13) Eleuthera Island, Bahamas,(TS Imelda 47m)...
#14) Ft. Lauderdale, Florida,
#15) Southampton, New York,
#16) St. Pierre, Newfoundland,
#17) Gulf Shores, Alabama,
#18) Nuevitas, Cuba,
#19) Great Abaco Island, Bahamas,(TS Imelda 4m)...
#20) Tampa, Florida
Jim Williams' past year's predictions and the storms that affected the chosen locations...
2024 top 5:
#1) Great Abaco Island, Bahamas (Hurricane Milton bdbr),
#2) Bimini, Bahamas (0),
#3) Nassau, Bahamas (0),
#4) Andros Island, Bahamas (0),
#5) Cayman Islands (hurricanes Beryl & Rafael)
Very high threat 2 of 5 40%, miles from center 84.5, All 11 of 20 52%, Predicted 28 to 30 named storms ended with 18.
2023 top 5:
#1) Western Bahamas (0),
#2) Eastern Carolina (TS Idalia / Ophelia),
#3) N.E. Cape Cod (Hurricane Lee br),
#4) Bangor, Maine (PT Hurricane Lee br),
#5) Alabama (0)
Very high threat 3 of 5 60%, av miles from center 53, All 15 of 20 didn't do, Predicted 10 to 12 named storms ended with 20.
2022 top 5:
No predictions were done in 2022.
2021 top 5:
#1) Wilmington, North Carolina (TS Elsa),
#2) Cayman Islands (TS Grace & Ida),
#3) Belize (0),
#4) Negril, Jamaica (TS Grace),
#5) Homosassa, Florida (TS Elsa)
Very high threat 4 of 5 80%, av miles from center 41, All 15 of 20- 75%, Predicted 20 to 24 named storms ended with 21.
2020 top 5:
#1) Cancun, Mexico (TS Cristobal, TS Gamma, Delta, Zeta brush),
#2) Cayman Islands (TS Laura brush, TS Eta),
#3) Manzanillo, Cuba (TS Laura),
#4) St. Pierre, Newfoundland (extratropical Teddy),
#5) Brownsville, Texas (Hurricane Hanna brush)
Very high threat 5 of 5 100%, av miles from center 55, All 17 of 20- 85%, Predicted 18 to 20 named storms ended with 30.
2019 top 5:
#1) Bermuda (Hurricane Humberto),
#2) Nassau, Bahamas (0),
#3) Fernandina Beach, Florida (Hurricane Dorian brush),
#4) Wilmington, North Carolina (Hurricane Dorian brush),
#5) Grand Isle, Louisiana (TS Barry)
No video or blog was done in 2019.
Very high threat 4 of top 5 80%, av miles from center 61, All 9 of 20=45%, predicted 13 to 15 named storms ended with 18.
2018 top 5:
#1) Sable Island, Nova Scotia (TS Chris),
#2) Wilmington, North Carolina (Hurricane Florence, TS Michael brush),
#3) Myrtle Beach, South Carolina(TS Florence, TS Michael brush),
#4) Cape Hatteras, North Carolina (Hurricane Florence brush, TS Michael brush),
#5) Isle of Youth, Cuba (Subtropical Alberto & Hurricane Michael brush)
Very high threat 5 of top 5 100%, av miles from center 49, All 9 of 20=45%, predicted 11 to 13 named storms ended with 15.
2017 top 5:
#1) Sable Island, Nova Scotia (0),
#2) Gulf Shores, Alabama (Hurricane Nate brush),
#3) Marathon, Florida (Hurricane Irma),
#4) Isle of Youth, Cuba (TS Philippe brush),
#5) Cayman Islands (0)
Very high threat 3 of top 5 60%, Av miles from center 36, All 12 of 20=60% predicted 12 to 14 named storms ended with 17.
2016 top 5:
#1) Fort Walton Beach, Florida (0),
#2) Panama City, Florida (0),
#3) Great Abaco Island, Bahamas (Hurricane Matthew brush),
#4) Key West, Florida (0),
#5) Cape Hatteras, North Carolina (TS Hermine, Hurricane Matthew brush)
Very high threat 2 of top 5 40%, av miles from center 44, All 9 of 20=45% predicted 14 to 16 named storms ended with 15.
2015 top 5:
#1) Port Charlotte, Florida to Naples, Florida (0),
#2) Panama City, Florida (0),
#3) Key West, Florida (0),
#4) Morgan City, Louisiana (0),
#5) Matagorda, Texas (TS Bill)
2015 video explanation |
2015 archive of predictions |
Map highlighting threat areas. |
NHC 2015 hit map
Very high threat 1 of 5 20%, av miles from center 0, all 3 of 20= 15% predicted 9 to 11 named storms, season ended with 11. First year using my own El Nino Analog years.
2014 top 5:
#1) Matagorda, Texas (0),
#2) Galveston, Texas (0),
#3) Naples, Florida (0),
#4) Miami, Florida (0),
#5) Isle of Youth, Cuba (0)
2014 video explanation |
2014 archive of predictions |
Map highlighting threat areas. |
NHC 2014 hit map
Predicted 9 to 11 named storms, None of top 5 impacted 0%, all 3 of 20= 15%, ended with 8 storms
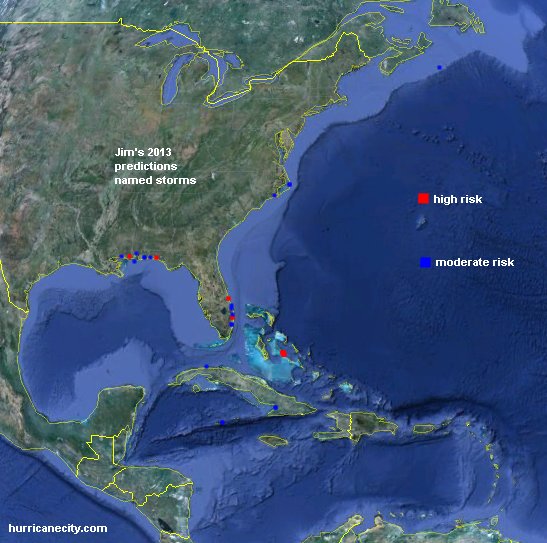
2013 top 5:
#1) Pascagoula, Mississippi (0),
#2) Fort Walton Beach, Florida (0),
#3) Vero Beach, Florida (0),
#4) Great Exuma Island, Bahamas (0),
#5) Boynton Beach, Florida (0)
2013 video explanation |
2013 archive of predictions |
Map highlighting threat areas. |
NHC 2013 hit map
None of top 5 impacted 0%, ended with 14 named storms, a terrible prediction year. This was my first year using ENSO as a factor based on Dr Gray's number of named storms.
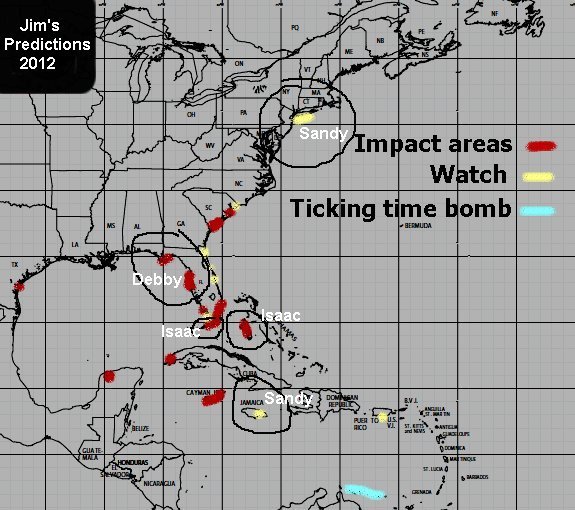
2012 top 5:
#1) Cabo Corrientes, Cuba (western tip) (0),
#2) Beaufort, South Carolina (0),
#3) Key Largo, Florida (TS Isaac brush),
#4) Spring Hill, Florida (TS Debby brush),
#5) Merida, Mexico (0)
3 of top 5 very high threat 60%, av miles from center 74, 60% All 9 of 20 =45% based on 11 to 13 named storms ended with 19.
2011 top 5:
#1) Boca Raton, Florida (0),
#2) Grand Bahama Island, Bahamas (Irene),
#3) Boynton Beach, Florida (0),
#4) Great Exuma Island, Bahamas (Irene),
#5) Belize (Harvey)
3 of top 5 very high threat 60%, av miles from center 18, All 6 of 20 =30% based on 11 to 14 named storms ended with 19.
2010 top 5:
#1) Vero Beach, Florida (0),
#2) Fort Walton Beach, Florida (0),
#3) Fort Lauderdale, Florida (Bonnie),
#4) Pascagoula, Mississippi (0),
#5) Boynton Beach, Florida (0)
1 of top 5 impacted 20% , av miles from center 42, all 6 of 20 impacted 30% based on 13 to 15 named storms ended with 19.
2009 top 5:
#1) Grand Bahama, Bahamas (0),
#2) Cancun, Mexico (0),
#3) Bluefields, Nicaragua (Ida),
#4) Fort Lauderdale, Florida (0),
#5) Pascagoula, Mississippi (Ida)
3 of top 5 very high impacted 60%, av miles from center 34, All 8 of 20 =40% based on 13 to 14 named storms ended with 9.
2008 top 7:
#1) Saint Martin (Omar),
#2) Antigua / Guadeloupe (0),
#3) Grand Bahama Island, Bahamas (0),
#4) Destin, Florida (0),
#5) Vero Beach, Florida to Lake Worth, Florida (Fay),
Ticking time bomb = Morgan City, Louisiana (Gustav)
2 of top 5 very high threat impacted 40%, ave miles from center 32, All 12 of 20= 60% forecast 14 or more named storms ended with 16.
2007 top 7:
#1) Elizabeth City, North Carolina (Gabrielle),
#2) Belize (Dean),
#3) Bluefields, Nicaragua (0),
#4) Antigua (0),
#5) Martinique (Dean)
3 of top 5 very high risk 60%, miles from center 40, All 6 of 20 = 30% based on 12 to 13 named storms ended with 15.
2006 top 5:
#1) Vero Beach, Florida (Ernesto),
#2) Pascagoula, Mississippi (0),
#3) Sable Island, Nova Scotia (0),
#4) Mobile, Alabama (0),
#5) Cape Hatteras, North Carolina (0)
1 of top 5 impacted 20%, miles from center 22, 8 of 20 =40%. Based on 14 or more named storms ended with 10.
2005 top 7:
#1) Punta Allen, Mexico (Emily),
#2) Gulfport, Mississippi (Katrina),
#3) Pascagoula, Mississippi (Katrina),
#4) Vero Beach, Florida (0),
#5) Biloxi, Mississippi (Katrina)
.... "notice the Mississippi heavy leaning"
4 of top 5 very high threat 80%, miles from center 37, All 13 of 20= 65% based on an active season, ended with 28.
2004 top 6:
#1) Fort Walton Beach, Florida / Pensacola, Florida (Ivan),
#2) Cape Hatteras, North Carolina (Alex),
#3) Acklins Island, Bahamas (Frances),
#4) Cozumel, Mexico (0),
#5) Cabo Corrientes, Cuba (Ivan)
4 of top 5 impacted 80%, miles from center 29, All 5 of 13 38.47% based on 14 or more named storms ended with 15.
2003 top 10: very high / high threat
#1) Halifax, Nova Scotia (Juan),
#2) Cozumel, Mexico (overdue mention, Claudette),
#3) Brownsville, Texas (Erika),
#4) Belize City, Belize (0),
#5) Elizabeth City, North Carolina (Isabel)
4 of top 5 very high threat 80%, miles from center 27, total impacted 14.63% of 41 picks ended with 16 named storms
VERIFICATION since 2003:
Average top 5: 54.3% or roughly near three of top five cities on average.
6 to 20 city picks since 2004: 47%.
Miles from city center of cities impacted: 42 miles
Average top 5: 54.3% or roughly near three of top five cities on average.
6 to 20 city picks since 2004: 47%.
Miles from city center of cities impacted: 42 miles
.jpg) [an error occurred while processing this directive]
[an error occurred while processing this directive]
MODELS / PREDICTIONS
- Long range GFS
- ECMWF model homepage, Atlantic animation
- WeatherOnline UK choose model
- Animated versions of CMC, GFS, EURO, HWRF, HMON, NAVGEM (FSU)
- UKMET Pivotal Weather
- UKMET FSU Cyclone Phase
- NRL Tropical cyclone page
- Tropical Tidbits models
- Weather Underground tropical info
- Joint Typhoon warning center
WINDS
BUOY & SHIP DATA
SEA SURFACE TEMPERATURES
SATELLITE LOOPS & TIDES
- GOES Image Viewer
- RAMMB/CIRA floaters
- RAMMB/CIRA SLIDER
- Satellite floaters from Weathernerds.org
- Microwave imagery
- Build your own satellite page.
- Expected high tides for areas affected by tropical systems.
- Crown Weather services zooms in on storm
- Wave forecasts for western Atlantic basin
- Past full disk GOES imagery (every 3 hours)
.gif)