HurricaneCity Database for Hurricane & Tropical Storm Landfalls
Welcome to our city database. Click any city or island for statistical information on effects from Hurricanes & Tropical Storms within or near the core. (139 locations) Database updated to include the 2024 season.
These database statistics are based on many different reliable sources. The following types of sources were used: Hurricane books written by forecasters/researchers, NOAA (NHC/TPC) databases, HURDAT2, NHC past track maps, newspaper articles dating back to the 1930s, television / video references, interviews with victims & forecasters. Jim Williams has spent numerous hours viewing microfilms in libraries for data from old newspaper articles and using detailed maps with the Hurrtrak program. The calculations are found to be relatively accurate based on similar results found graphically at the National Hurricane Center seen here. An example of the zoomed in accuracy using the 2017 tracking map from the NHC shows two hurricanes that came into Mexico near Tuxpan. Upon closer examination using the Hurrtrak program we find a brush from Hurricane Katia as seen in the red hurricane force wind field unless otherwise stated from NHC or HURDAT. Please keep in mind that these numbers/averages change every year based on the previous hurricane season. After the 2017 season an editorial decision was made to eliminate some cities that were too close together and add others to fill gaps. If your city is not listed, please refer to the nearest city to your location for reference. The cities and islands listed below are ranked on what areas get affected most. Newspaper images are provided in part by Fred's Long Island Weather and radar animations provided by Brian McNoldy, Univ. of Miami, Rosenstiel School. Thank you & enjoy using the HurricaneCity database. Feedback is welcome.
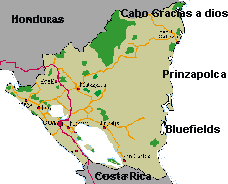
The least affected area from our database is Prinzapolka, Nicaragua,at 17.62 years.
On average only 10 to 20% of the locations in the database are overdue, so the numbers are pretty accurate.
Video extremes from database
On average only 10 to 20% of the locations in the database are overdue, so the numbers are pretty accurate.
Video extremes from database
.png "SciLinks from National Science Teachers Association")
Alphabetical Index (by Country, followed by American states)
A -
B -
C -
D -
E -
F -
G -
H -
I -
J -
K -
L -
M -
N -
O -
P -
Q -
R -
S -
T -
U -
V
ABC ISLANDS
Aruba, Bonaire & Curacao

CAPE VERDE ISLANDS
Cape Verde Islands


UNITED STATES
FLORIDA
Apalachicola
Cape Canaveral
Cedar Key
Chokoloskee
Daytona Beach
Delray Beach
Fernandina Beach
Fort Lauderdale
Fort Myers
Fort Walton Beach
Homestead
Homosassa
Jacksonville
Key Largo
Key West
Marathon (inc Big Pine Key)
Melbourne
Miami
Naples
Palm Beach
Palm Coast
Panacea
Panama City
Pensacola
Port Charlotte
St. Augustine
Sarasota
Spring Hill
Steinhatchee
Stuart
Tampa
Tarpon Springs
Vero Beach

NEW JERSEY
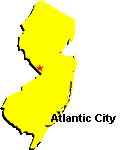
Atlantic City


RHODE ISLAND
Providence

.jpg)
.gif)