
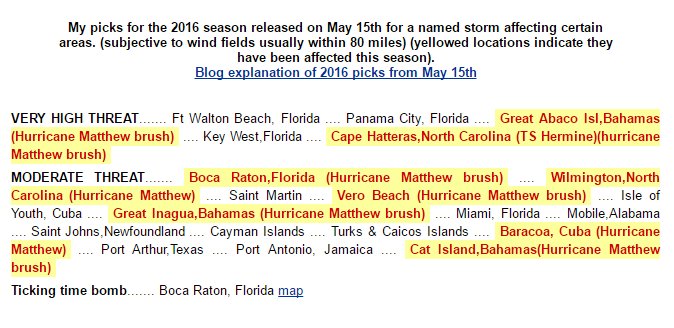
After finishing up an active Atlantic Hurricane season which had 15 named storms I have mixed emotions on how bad it was vs how bad it could have been. Back on May 15th I released my city predictions and stated we should see 14 to 16 named storms give or take. I also stated that we would see impacts in the Florida panhandle, Bahamas, Fla’s Treasure coast & the Hatteras area all of them were impacted. I also drew a map showing potential tracks in which Hurricane Matthew came close to following but thinking on the 14 to 16 number is ironic considering I have picked 2 or more of my top 5 cities correctly 14 of the past 16 years. Here is a screen shot of my city picks from May 15th,2016 and you can read all the details & methodology.
In order to properly explain how it could have been much worse I need to emphasize the difference between a brush a hit and/or a landfall using mainly Hurricane Matthew as an example. The National Hurricane Center and other NOAA agencies dislike discussions of points on a map showing the center but that point can make all the difference if a hurricane force wind field extends 25 miles from the center and your city or island happens to be 35 miles away. I know it is not this simplistic as a “wall” of wind is not a sharp single point and a wobble can bring those hurricane force winds in. Rain and surge can extend well beyond a landfall point but the worst of the damage in most cases will happen mainly where the core comes ashore. With recon data, drones, satellite, radar and most importantly land instrument observations we can clear up what was a hit of hurricane force winds vs a brush of tropical storm force winds. My personal subjective method for a hit is usually hurricane force winds gust’s for at least a couple of hours along with wind field mapping and radar showing the core touching land plus post tropical cyclone reports from NHC complete the puzzle. A hit can happen without the eye making landfall on a location with numerous historical hurricanes having only a portion of the core high winds hitting causing devastation. A good example of a point on a map is the basin’s first system hurricane Alex back in January . This system had such a small hurricane force wind field that when it passed through the Azores the hurricane force wind field (in red) missed all the islands causing this to be a brush rather than a hit.(green maps below courtesy of PC weather products)
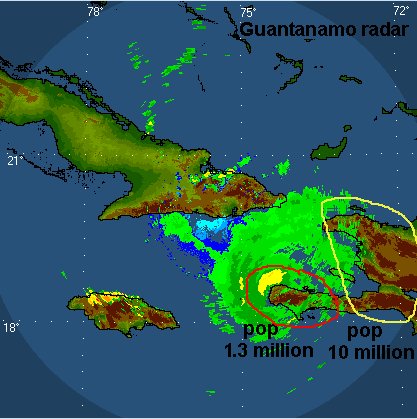
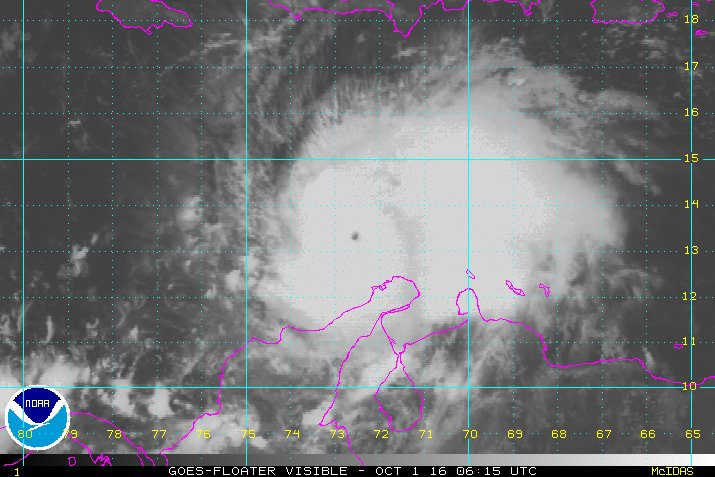
By far the biggest story of the year was Hurricane Matthew and had he shifted right early then left later we could have seen a far greater death toll and damage total. Consider Matthew’s hit on Haiti’s Tiburon peninsula was 108 nm west of Port Au Prince with a hurricane force wind field extending 60 miles from the center just a 40 to 50 mile right shift would have put nearly 10 times the population in hurricane,surge and torrential rain conditions. With reports of over 1,000 killed could we have expected ten times as many deaths? (speculative but not unreasonable). The torrential rains associated with the core in itself would have most likely caused landslides & flooding of biblical proportions. Looking back on this season and thinking about several hundred families losing a family member is so sad, for them this season was VERY BAD.
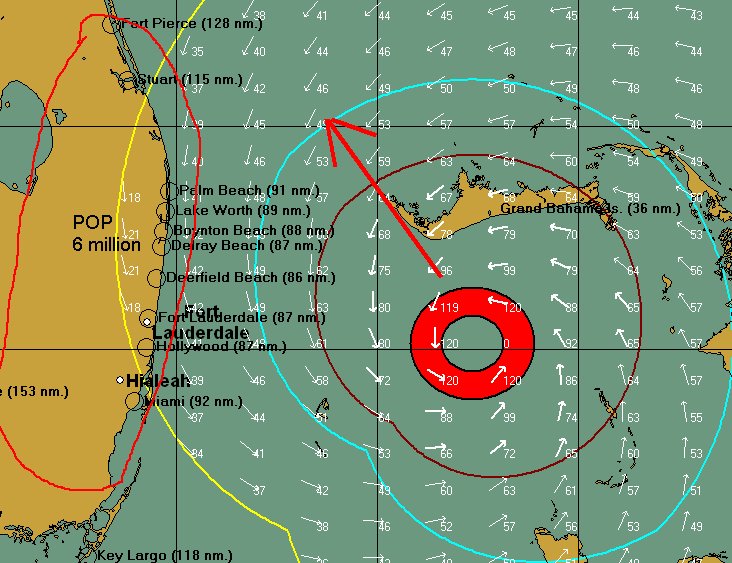
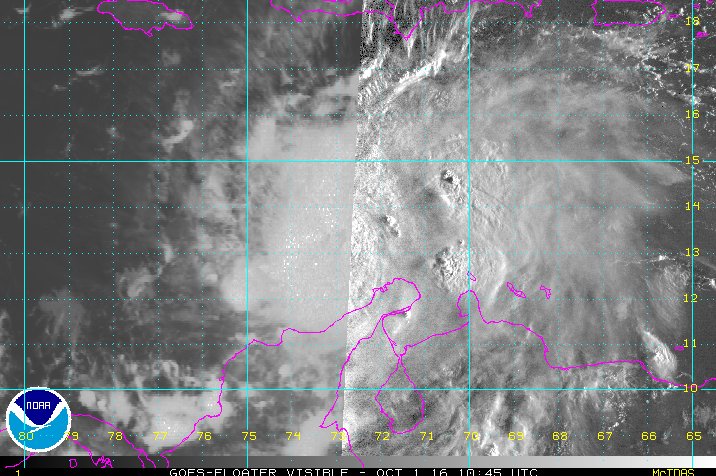
As Matthew moved N.W he caused very heavy damage in areas that took direct hits such as Baracoa, Cuba, Nassau, Andros & Grand Bahama islands. However when it came to Florida the difference between a brush and a hit was the difference between back to work within a couple of days or we have a lot of cleanup to do. With no landfall taking place in Florida the state was spared what could have been devastation to over 75% of Florida’s east coast. As for S.E Florida a brush is in order but a hit would have been the biggest hurricane tracking story since 2005. With S.E Florida brushed the hit vs brush scenario is more difficult to determine in north Florida as the western eye wall touched the coast in some locations but not in others. For continuity sake I will consider all north Florida east coast locations in the database as a hit considering most coastal cities had hurricane force gust’s.
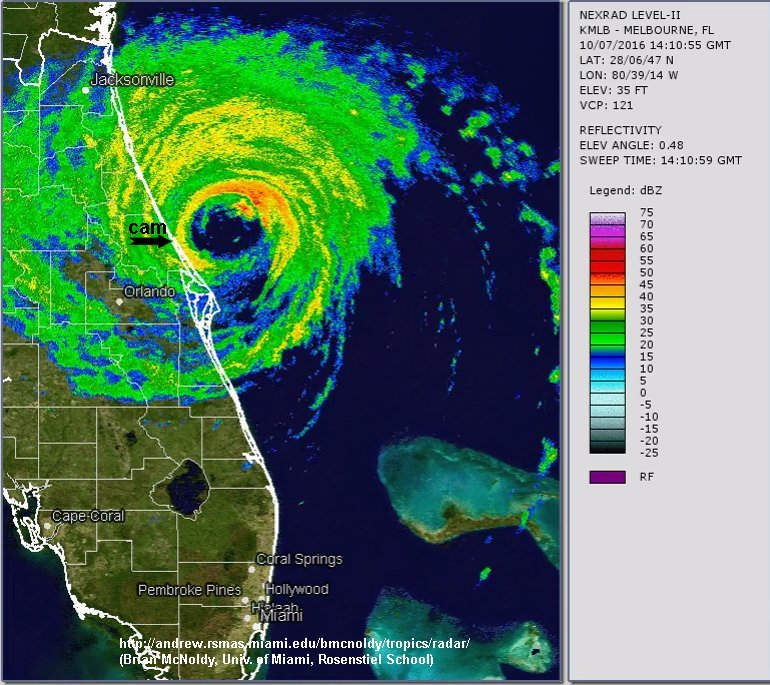
I was personally up in New Smyrna beach to film Hurricane Matthew at the point of closest approach. In this video the surge was minimal compared to what it could have been with an onshore flow as you’ll see around 2 minutes into the video.
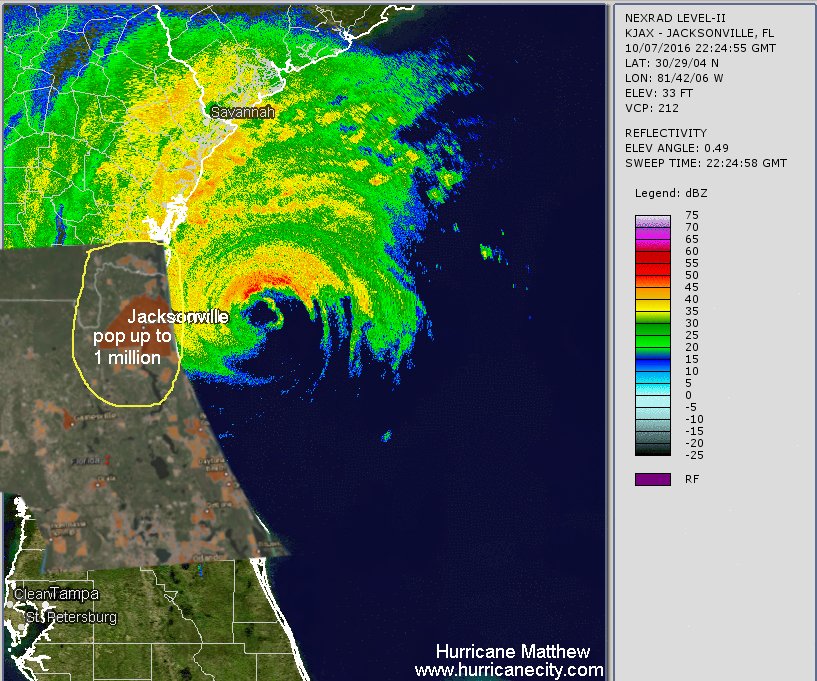
Depending on elevation or how much seawall protection was the difference between no onshore surge or coastal roads flooded by surge as seen further north in Jacksonville considering Matthew was further off the coast up that way. The bottom line was had the track been even 30 miles west the flooding would have been much more substantial. Once again a huge population spared the worst of what Matthew had to offer.
After brushing the Brunswick,Georgia area Matthew passed just east of Tybee Island but caused a record breaking surge of 12.5 ft breaking the previous high of 12.2 ft according to the Chatham County Emergency Management Agency. Matthew rode the coast of the Carolina’s after moving onshore near Mc Clellanville,SC on Oct 8th @ 11:00AM ET with 75mph winds. While traveling along the coast Matthew dumped heavy rain on areas already affected by three to four tropical systems this season depending on the city. The over saturation in combination with surge caused massive flooding problems extending into inland areas. Overall from Florida to Virginia Hurricane Matthew took 46 lives primarily as a result of flooding. As Matthew moved along the N.C coast the tropical storm wind field extended out much further as much as 240 miles from the center. Basically an expanding sponge that drops it’s contents before heading out to sea.
My bullet points about the season not being as bad as it could have been.
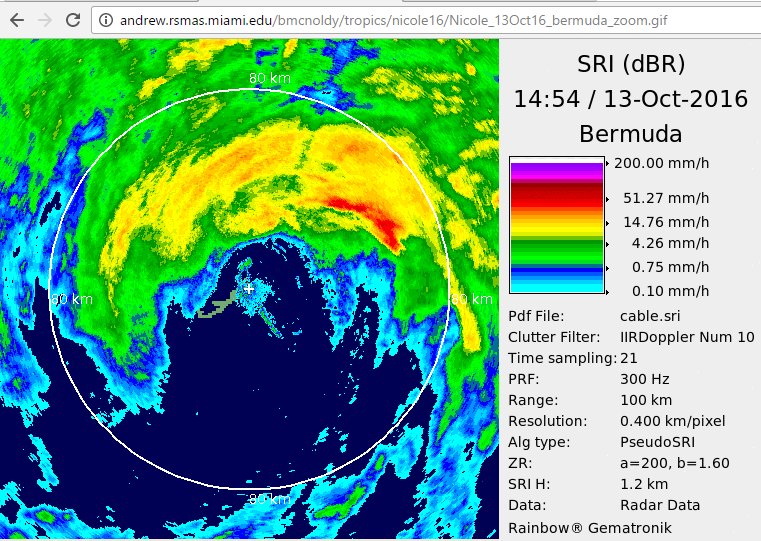
My research/stats on cities & islands will continue for this very reason (one city or island can be the difference between a brush and a hit) The tiny island of Bermuda (20.6 sq miles) in the middle of the atlantic has been hit by a hurricane 3 times in the past 3 years. Nicole hit Oct 13th with 120mph winds as the eye passed over a virtual needle in a haystack (point on a map). By recording stats city by city & island by island is equivalent to looking under a microscope allowing stats such as the city rankings which will be updated this off season.
To see my predictions please visit Jim’s predictions and for recorded media of the hurricanes covered this past season & others please visit HC video archive page I will be live tonight @ 8:00PM ET to discuss the season please watch thank you for reading…..Jim Williams

 .
.
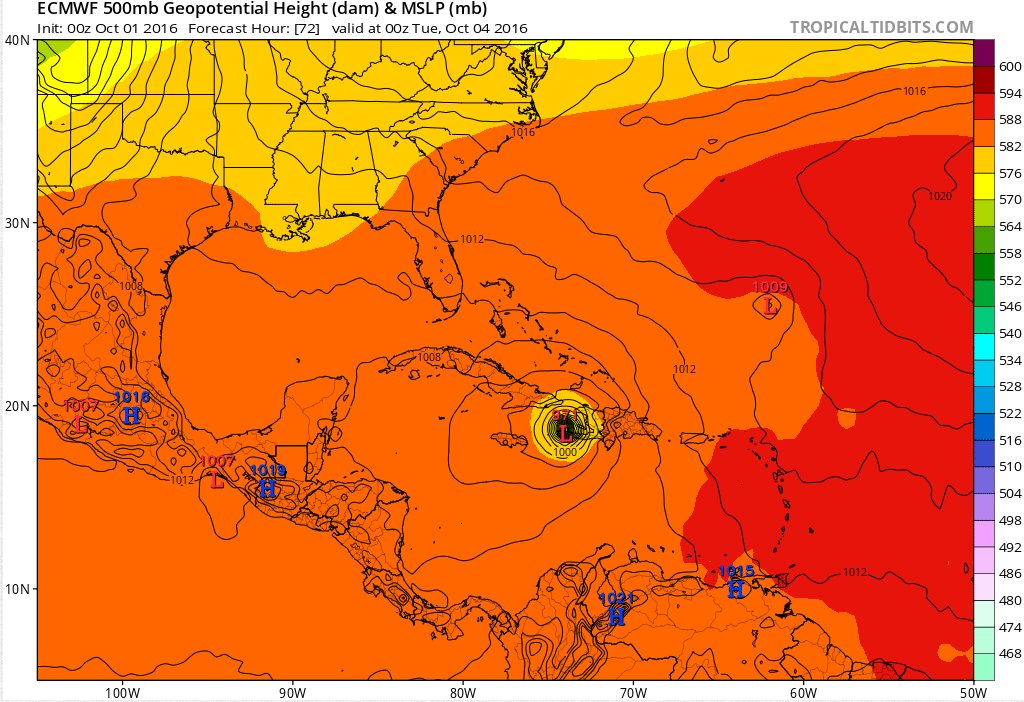 Of course this track changes from run to run as do the other models but we look for trends. Once these systems become major they carry a lot of energy as we have seen in the past with Sandy and Ike bringing huge surges on landfall’s long after being major. The land masses out in front of Matthew regardless of intensity should experience high storm surge and winds for south shores of Jamaica, east Cuba and Haiti on Monday /Tuesday. After that the Bahama islands some of which were hit by Hurricane Joaquin as a cat 3 last year may see a repeat or maybe the N.W Bahamas as the GFS model is showing. Finally the U.S impacts are not yet clear but Matthew could come very close to Florida the S.E and possibly mid Atlantic states but the EURO keeps it further away subject to change. Right now my focus is on the Greater Antilles and Bahamas facing a major threat with millions in harms way.
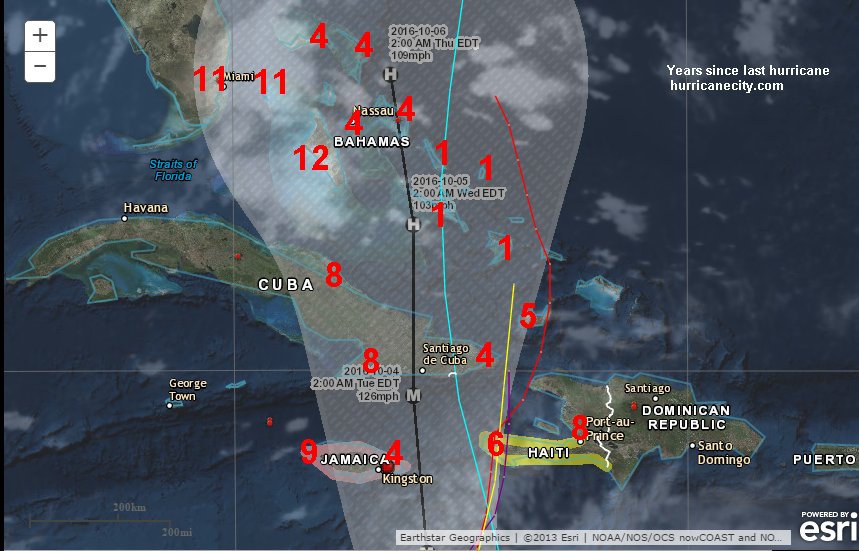
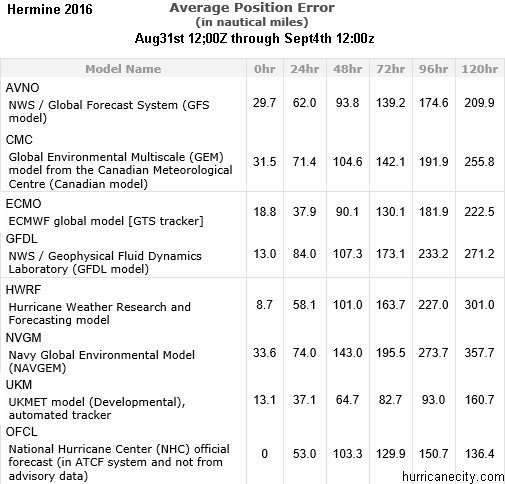
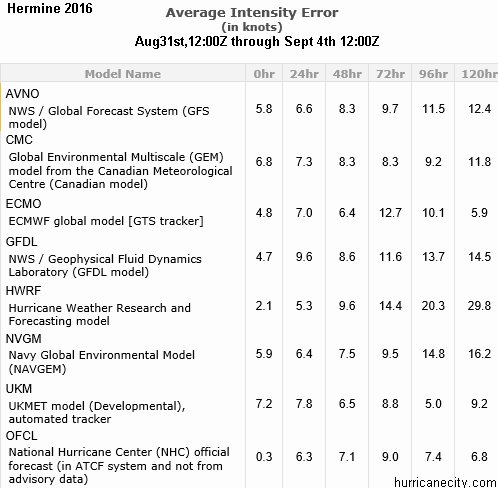
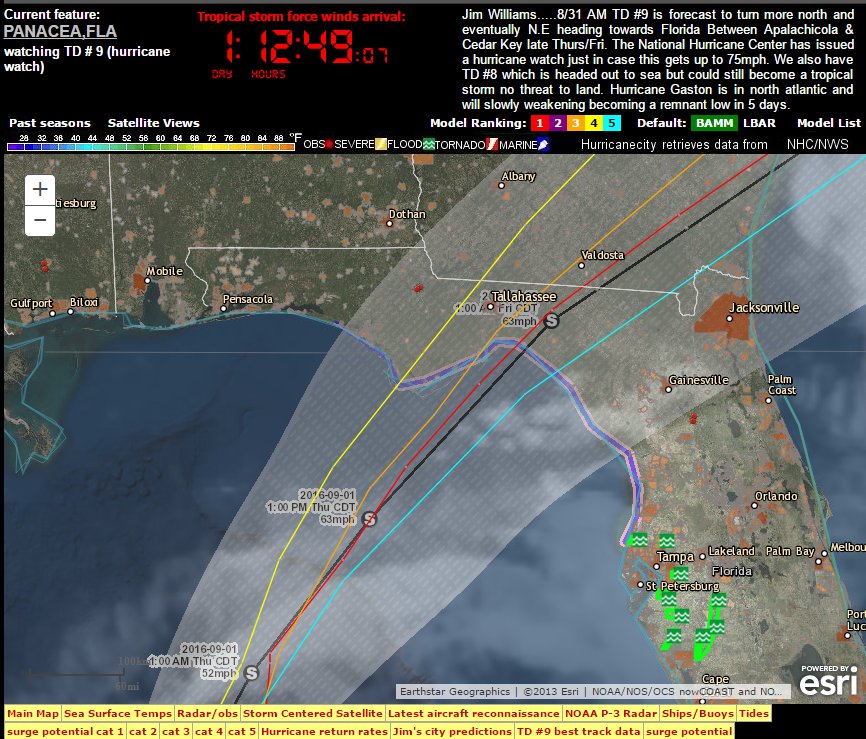
 Hurricane Hermine made landfall on Friday at 1AM just as predicted but with 80mph winds slightly higher than the projected 75mph point is outstanding job by NHC. Was the forecast perfect? no, if not for the stubborn GFS not showing development NHC may have upped the hurricane landfall chances much sooner. Forward to the threat to New England the cone above shows uncertainty off the coast which ended up happening as Hermine circled as a post tropical storm for days. I do think it is a great idea to have NHC continuing advisories on post tropical systems as the threat to lives and property resumes and can increase the expanse of threatened areas. The watches and warnings were necessary due to the expanding size of Hermine off New England with several models such as the HWRF and GFDL showing a track very near the coast,NHC could not take chances on the heels of Sandy in 2012. On a final note the NHC track forecast cone is the best tool for figuring out where a system will go especially short range but it is time to eliminate the poor performing models and start more funding for the better ones starting with the GFS.