Jim’s hurricane city predictions for 2016

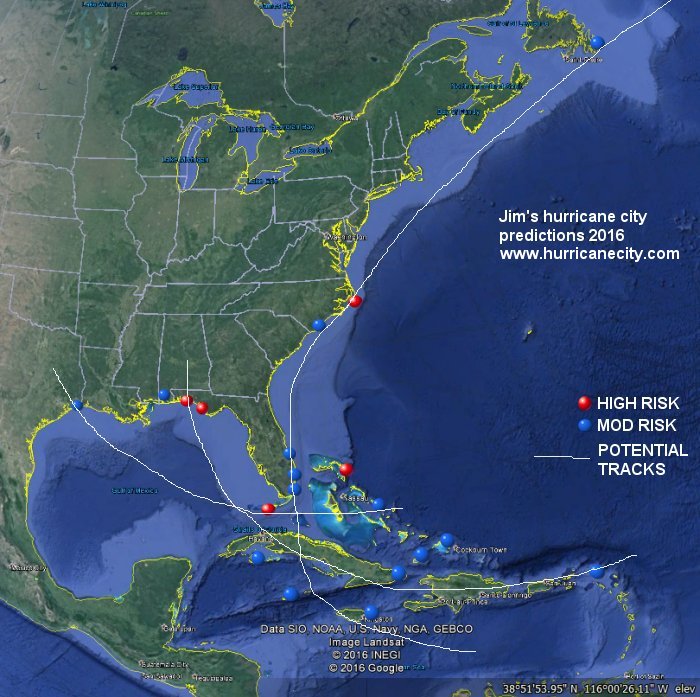
For the 2016 Atlantic Hurricane Season I am expecting tracks from north turning systems in the Gulf Of mexico,N.W Caribbean and Bahamas with my highest risk areas in the northern Gulf of Mexico.
By: Jim Williams……. Since 2003 I have chosen 20 locations from the hurricanecity database each year that I think will be affected by a named storm before the season starts. On average two or more of my top five areas ends up getting hit by a tropical storm or hurricane or 11 of 13 years not bad!. Last year my #5 pick Matagorda,Texas was hit by Tropical Storm Bill early in the season just as I said in the video from last year. On the remaining 15 usually 1/3 of the locations I choose will be impacted by the tropical storm force wind field of a named storm. An example of this was last year Hurricane Joaquin the worst of the season hit # 15 San Salvador,Bahamas and impacted #13 Bermuda. This year I have decided to write a blog rather than produce a video mainly due to time constraints, but if you would like to see all past years videos ,maps and results please visit my predictions page.


METHODOLOGY

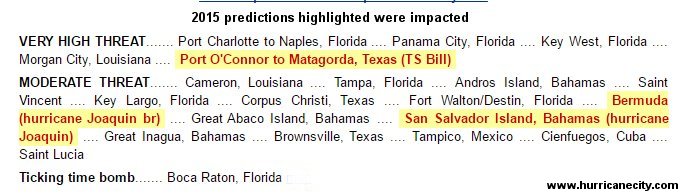
Every year there is usually one or more areas that will be impacted that I do not pick so any area can get hit, but if you are in my top five be prepared to batten down the hatches. As was the case last year I am using eight criteria listed in the order of importance from top most important to bottom least. This year I have added a new predictor (testing) Mexico (pacific side) hit by a hurricane and who gets hit in Atlantic the following season. I am basing my predictions this year on a busy season of roughly 14 to 16 named storms give or take.

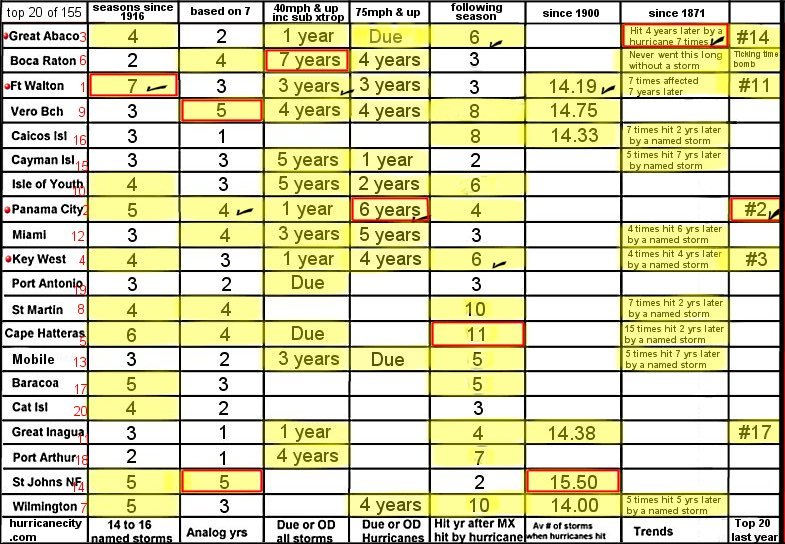
  • 14 to 16 named storm seasons how many years storms hit each location since 1916.(need 4 or more to quality)
  • Analog years of 1964,1966,1973,1988,1995,1998 and 2010 based on model enso forecast deep into season predicting below av equatorial temps in east Pacific.(need 4 or more to quality)

Analog years chosen
 

source Climate prediction center

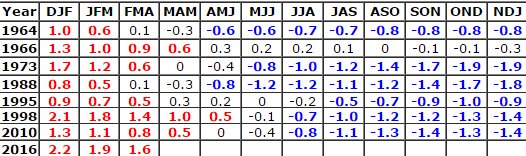
  • Av # of storms when hurricanes hit +1.50 to account for missing storms in past since 1900.(need 14.00 to 16.00 to quality)
  • Statistically due or overdue all storms back to 1871 (yes it means something this is why it has worked).
  • Statistically due or overdue hurricanes only.
  • Trends: example Great Abaco Isl hit by Hurricane Sandy 4 years ago, 7 times they have been hit by a hurricane 4 years later. This worked for Bermuda last year with a rich history of being affected 3 years in a row.
  • Amount of seasons hit by named storm season after Pacific Mexico hit by a hurricane.(experimental need 4 or more to quality)
  • Was location in my top 20 last year?

Now after adding up all the stats I graph the findings and high lite the qualifiers above in yellow. The most any location met was six yellow boxes which puts them at the top of the list. From there an assortment of tiebreakers is needed which helps me arrive at my top 20. On a side note I have tried to add other criteria such as coastal SST’s in April but after researching the available data it appears there is no connection to local sea surface temperatures and named storm landfalls. In fact in 2005 pre season coastal temps in the Katrina zone were well below normal but above normal when other hurricanes have hit. In 2005 pre season I predicted a heavy hit on Mississippi before the 2005 season started with most of my current criteria. Numerous weather companies and individuals have tried to predict where storms will go often scanning to globe for clues. To this day I have not seen any predictions match my statistical scheme other than vague large geographical areas with small percentage predictions or 30% Atlantic coast av 31% which tells you very little. When I started making these predictions in 2003 I said I would give it a few years and if it fails I will give it up, I had no idea it would be this successful, so lets see if this year is any different. My 20 locations listed on the graph below were picked based on years (14 to 16 named storms) since 1975 due to certainty of satellite viewed storms in the entire basin . Since 1990 we have seen av decadal numbers of over 110 named storms with 2001 -2010 having 153 or 15.30 storms per year where previous decades av below 100 or -10.0 storms. Red boxes indicate the winner in each category and check marks are for top 5 winners.

prediction graph

    This year I feel confident that any city or island on this list could be equally affected. It is also important to note that surrounding cities could be equally impacted especially by larger systems. If your location is not on this list it does not mean your chances are any less as a location or two will usually be impacted outside my top 20.

  • 1) Fort Walton / Destin, Florida
  • 2) Panama City, Florida
  • 3) Great Abaco Island, Bahamas
  • 4) Key West, Florida
  • 5) Cape Hatteras, North Carolina
  • 6) Boca Raton, Florida
  • 7) Wilmington, North Carolina
  • 8) Saint Martin
  • 9) Vero Beach, Florida
  • 10) Isle Of Youth, Cuba
  • 11) Great Inagua, Bahamas
  • 12) Miami, Florida
  • 13) Mobile, Alabama
  • 14) Saint Johns, Newfoundland
  • 15) Cayman Islands
  • 16) Turks & Caicos Islands
  • 17) Baracoa, Cuba
  • 18) Port Arthur, Texas
  • 19) Port Antonio, Jamaica
  • 20) Cat Island, Bahamas
  • possible tracks

Is Hurricane Joaquin a threat to the U.S?

12 noon Oct 1st,2015 Hurricane Joaquin is pounding the central Bahama Islands of Little San Salvador and Acklins/Crooked islands as a major hurricane and this could continue for another 24 hrs before exiting the Bahamas. These islands were last affected by Hurricane Sandy in 2012 but only by the surrounding tropical storm force winds so Joaquin will be a completely different situation. The combined population of these 2 islands is roughly 2,200 full time residents that will likely never forget Hurricane Joaquin . These islands are hit directly by hurricanes roughly every 5 years on average so we hope the experience pays off for dealing with a hurricane as intense as Joaquin. The image below courtesy of PC weather products shows a very intense hurricane passing over my #15 pick to be impacted by a named storm this year Little San Salvador Island on Friday morning while moving north.
Joaquin position Friday morning (subject to error)

As of this post there has been significant changes to most global models shifting east to be more in line with the ever reliable ECMWF European model. While some others such as the tropical models like the GFDL & HWRF continue to show a potential landfall in the mid Atlantic region of the United States. While this story is still ongoing we have to ask the question of why there always seems to be a difference in guidance between the ECMWF (euro) & the GFS (American) models on a consistent basis. After sifting through numerous papers on the ECMWF the main culprit appears to be the ability of this model to weed out false forecast’s quicker and more efficiently than the GFS . Now there have been some recent upgrades to the GFS but apparently there is still more work to be done to effectively compete with the euro model and we hope that more computing power can lower the errors. Lets face it when you look at a plot of spaghetti models and see the majority using GFS input turning Joaquin towards the U.S the media goes nuts and the hype especially on social networking spreads like wildfire. I always tell people if the GFS and ECMWF agree on a similar track then the message can become more clear lowering the the doubt of what areas may be impacted.

Now compared to the Bahama islands the potential landfall area in the U.S has far less hurricane experience from Hitonhead Island S.C average a hurricane every 8 years with Norfolk Virginia getting a hurricane every 12 years. This makes you understand why a hurricane hit forecast puts more stress on residents not used to the drill or used to glancing blows rather than direct hits. The North Carolina outer banks however is the most impacted area by hurricanes, hit even more frequently than the central Bahamas so they are more familiar with the drill and preparations required for a direct hit. The National Hurricane Center does a very good job with the cone of error not swaying too much one way or the other based on wild fluctuations of certain models and social media hype. You can tell the respect NHC has for the ECMWF model as they never turned the cone to dive into the mid Atlantic like the GFS showed but rather cautiously bent the cone. Fluctuations of model tracks and uncertainty of the future is why it is so important to prepare well in advance of the average time frame that your area typically gets impacted. The hurricanecity.com database shows 152 locations data of hurricane history in the Atlantic basin with a graphic at the top of each page showing the most likely time based on averages to be impacted.

ave hurricane hit time

As is always the case with statistics hurricanes can always hit earlier or later than the average hit date so prepping at the beginning of the season is always the best bet. This may be my last post on Joaquin unless the threat to the U.S increases then I will be back with my impact cities. Until then do not take your eyes off Joaquin until it moves into the cold waters past the Canadian Maritimes or worst case scenario inland.

how the Greater Antilles save Florida from more major hurricanes

Sept 5th, 2015 after tropical storm Erika passed over Hispaniola just over a week ago it collapsed and this got me to thinking of how many past tropical systems have either missed or weakened while hitting Florida due to passing through the box below?
chopping block
These land masses especially Hispaniola have mountains up to 10,000ft and when hurricanes pass over or very near they often weaken or suddenly change direction only to resume their previous motion afterwards. I went back 144 years going through the National Hurricane Center map archives to see how often this has happened. I picked 13 past storms that in my opinion were altered just enough to lessen the Florida impact or cause the storm to miss altogether. I tried to take wind shear into consideration but prior to the 1990s this data is not mentioned in the NHC archives so I can only extrapolate what may have happened under low to moderate shear. The list below is based on 13 subjective systems about once every 11 years on average these islands may save Florida from a hit or from much more damage.

  • 1878 #5 Could have hit as cat 2 hit as Tropical storm.map
  • 1886 #5 Missed Florida was moving N.W when sudden weakening caused a west jog could have hit as cat 2.map
  • 1899 #2 hit as tropical storm could have been cat 2. map
  • 1916 #7 hit as tropical storm could have been a cat 3. map
  • 1958 Ella missed Florida was headed that direction suddenly weakening over East Cuba and changed direction could have hit as a cat 4. map
  • 1963 Flora missed Florida tangled in mountains of east Cuba while stalling,looping,weakening probably front approaching to pull her N.E but had Cuba not been there would she have continued N.W faster?could have hit as a cat 4 not confident.map
  • 1979 David kissed Palm Beach but had that track extrapolated to Florida with no land mass in way changing course possible cat 5 for Florida. David never fully recovered after interaction with land quite likely this could have been devastating for Florida.map
  • 1998 Georges hit keys as cat 2 without all the direction changes over Greater Antilles could have hit Florida as a cat 4. map
  • 2000 Debby dissipated over Antilles was progged by some models to be major in S Florida although it did have some SW shear could have hit as cat 3. map
  • 2006 Ernesto had a direct path to Florida but land interaction kept him at bay as a tropical storm. map
  • 2008 Gustav took a radical dip and reformation S.W after hitting Haiti had it maintained it’s original N.W path with no land in way could have hit Florida as a cat 3.map
  • 2012 Isaac more than likely weakening over Haiti and east Cuba caused a westward shift could have been a cat 1 or 2. map
  • 2015 Erika battled with wind shear but could have survived to make cat 1 in favorable conditions ahead if not for dissipating over Greater Antilles. map
  • So basically thinking an additional 6 majors for Florida with 3 potential since 1998 makes one realize how lucky Florida is to have these islands to it’s south and east. On another note there have been two impacts that may not have happened if the islands were not there, Inez in 1966 and Jeanne in 2004 may have caused these hurricanes to eventually hit Florida by radically changing courses. Most major hurricane impacts in Florida avoided this box so the next time a hurricane devastates the Greater Antilles our government should have no problem helping our neighbors to the south considering how much money and lives they may have saved…..Jim Williams