Jim Williams 2025 hurricane season predictions

Jim’s 2025 hurricane season land impact predictions

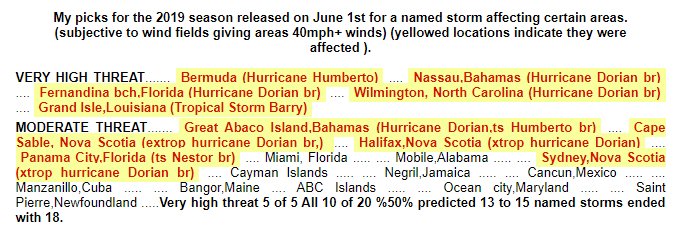
Hurricane season begins June 1st and it is expected to be another busy season but really all that matters is where they could hit.

I am calling for 18 to 20 named storms in which 12 will be hurricanes and 4 of those will be major 115mph plus. In some years I may factor in strength of systems I think could impact my top 20 but not this year. Too many of my analogs and trends showed tropical storm strength but we all know somewhere will be hit by a hurricane as well as by a major hurricane.

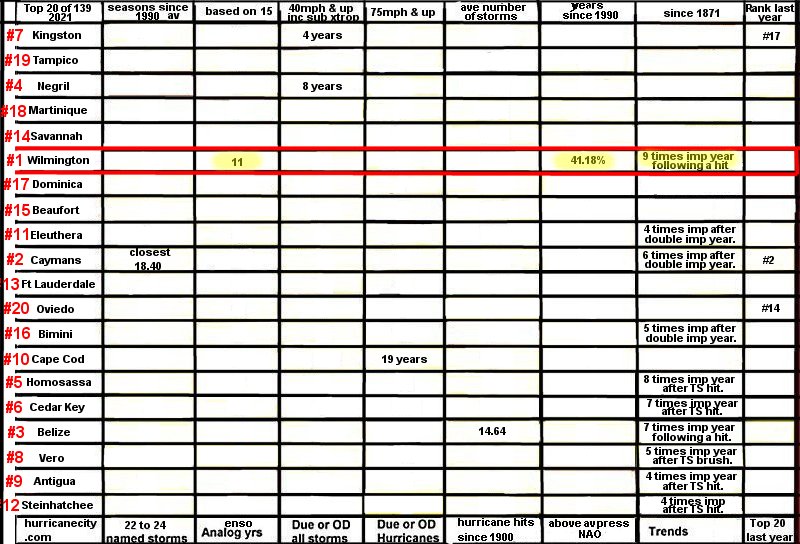
I start out with the 139 cities and islands in the hurricanecity.com database www.hurricanecity.com/cities.htm . In order for a city to be included for consideration to crack the top 20 it has to match at least 1 of the criteria listed below.

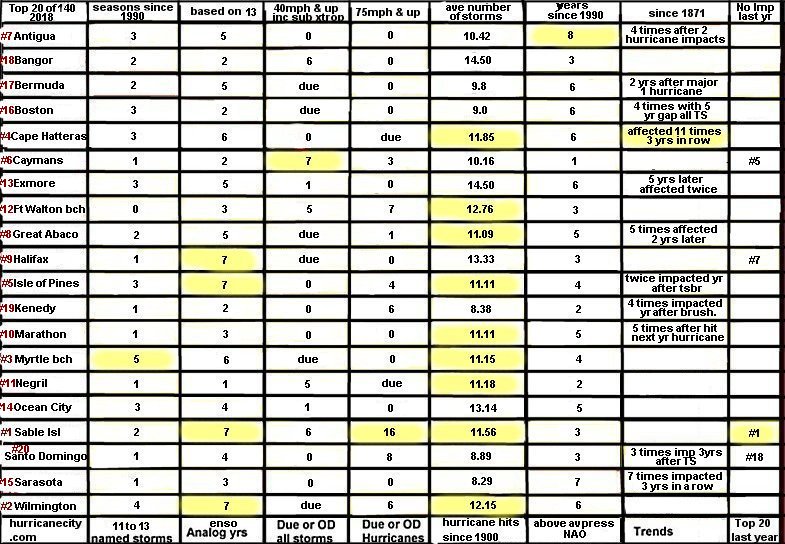
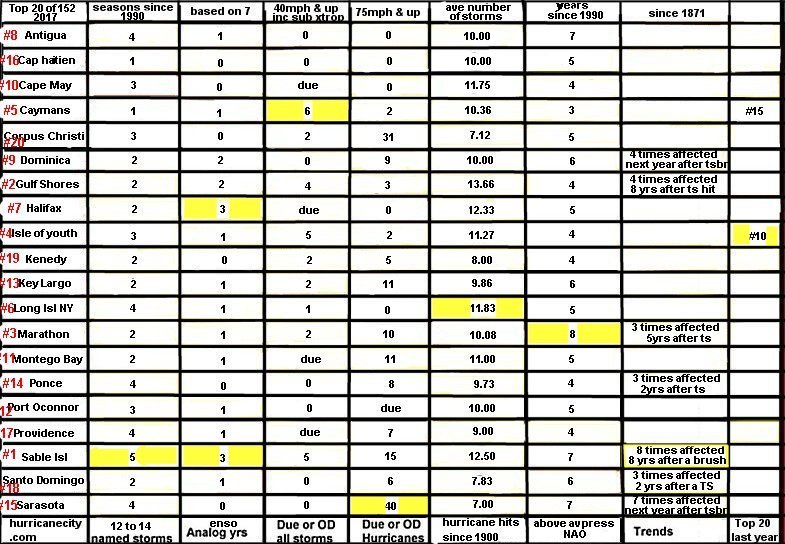
I got the list down to 94 locations where at least 1 criteria was met. The second phase was removing locations that had weak criteria such as only 1 or 2 analog years being met or areas with no trends or not being due or overdue. Now my list was down to 60 or nearly half of the database. I put a lot of weight in trends so if a city or island had a weak trend in combination with only 1 or 2 analog years they would be removed. This got the list down to 40 locations , which is where the real number crunching comes into play. The 40 chosen locations need to have at least 3 or more criteria from the list above to make the top 20. At this point it is basically choosing the strongest criteria especially trends which make you go “wow” getting the list down to 20. The chart below list’s the cities in alphabetical order and whoever wins the most criteria “yellow” is higher ranked.

https://www.youtube.com/@jimhurricanecity

One could argue looking at this chart the order of the top 20 as #1 Norfolk, Virginia won only 3 of the criteria. Had there been a location with 4 yellow area “winners” of each criteria they would have been #1. It came down to Norfolk matching 5 of my analog years, being statistically due and being impacted 16 times during Neutral ENSO seasons since 1950 being the determining factor. The map below shows the 20 chosen areas to be impacted by 40+mph winds by tropical systems during the 2025 Atlantic hurricane season.

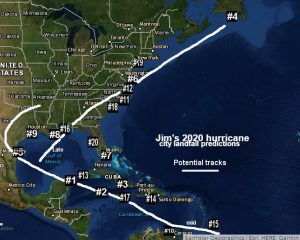
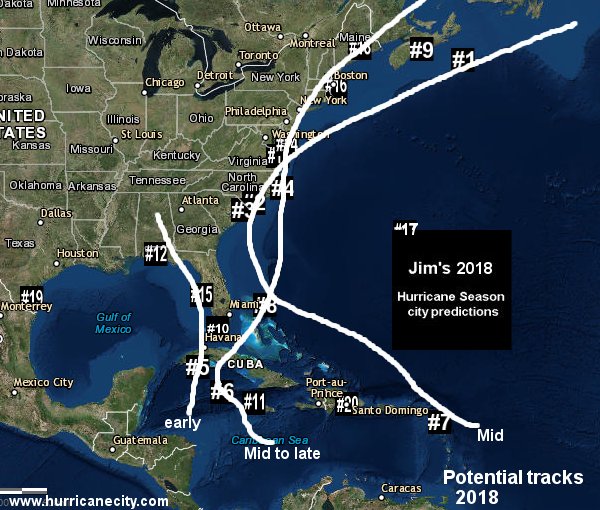
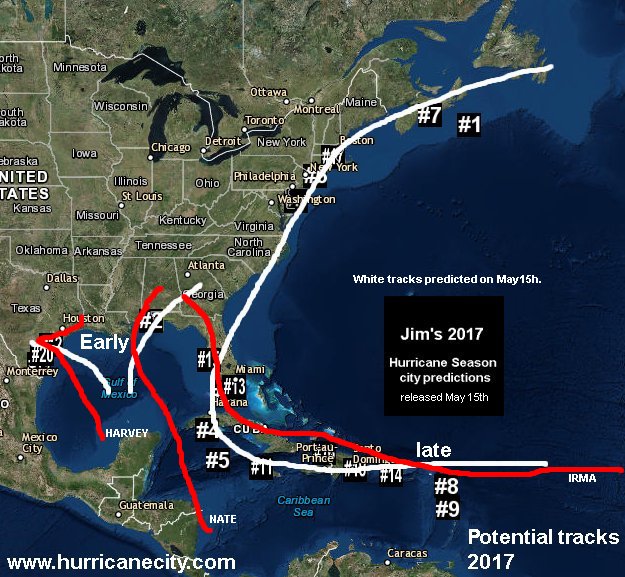
Grouping of locations allow for a circle indicating high risk as seen in the western Bahamas. Next would be the Mid Atlantic states followed by East central Gulf as more of a moderate risk. It would involve a lot of reading/scrolling to explain why other areas like Texas, South Carolina, Mexico, Jamaica and the Lesser Antilles did not make the top 20. I did make a video explaining partially why these areas were not chosen. This next map is my best guess at potential tracks based on the top 20.

By narrowing down predictions based on city by city and islands separately allow for exact number crunching. For example the statistics between Miami and Fort Lauderdale are slightly different . Each location has a gap distance of at least 50 miles some are a bit closer but allows for the statistics to be used for predictions. The red dots indicate all areas in the database and these tracks represent the swath of hurricane force winds I think could happen this season.

As I say every season every coastal area needs to be prepared regardless of threat potential seen here. Just about every season an area or areas get hit that are not on my list.

https://www.noaa.gov/hurricane-prep

As the season progresses you can watch as each city gets highlighted in yellow for being impacted by 40+mph.

Please visit www.hurricanecity.com/predictions.htm

I always look forward to feedback jim@hurricanecity.com I wish everyone a safe hurricane season.

2024 Hurricane Season landfall predictions

By : Jim Williams hurricanecity.com as each Atlantic hurricane season approaches you will hear and read about how many named storms there will be, the accumulated cyclone energy ACE, how many majors etc. but not much about where named storms could go.

The Atlantic hurricane season starts on June 1st and runs through November 30th. Each season some of the cities/islands in the database https://www.hurricanecity.com/cities.htm will be impacted possibly with significant impacts. My process begins by determining how many named storms there could be a busy vs moderate vs slow season makes a big difference in what areas could be impacted. After my range is determined I work on my ten criteria listed below to choose my top 20 out of 139 that possess some of the criteria. After the top 20 are chosen the number crunching begins to determine which of the 20 matches the most criteria to arrive at my top 5.

“If you know your cities history it’s only a matter of time, if your city/island is past it’s statistical due date watch out”

Several factors determine how many storms I expect with most ENSO models indicating a La Nina pattern which is favorable meaning less wind shear for developing systems , Warmer than normal sea surface temperatures and lower pressures. I also factor in what agencies are saying in regards to numbers of named storms then add storms for potential frontal systems that transition to become tropical along with recent predictions which have been lower than what actually happened. So this year I am calling for 28 to 30 named storms of which 10 to 12 will become hurricanes 4 to 5 of those major 115+mph .

The landfall predictions do not determine what intensity or exactly how close named storms will come to my chosen locations. My average is around 50 to 60 miles away give or take so it does not take a direct hit to be considered impacted. My last full forecast done in 2021 before health issues was an average of 41 miles from the center of the storm. Below is my list of criteria with a brief description of each and whether the top 20 have been impacted when this happened.

  • Seasons since 1990 with an average numbers of 19+ named storms with only Brownsville TX and Manzanillo Cuba reaching this criteria.
  • My chosen analog years based on projections of reaching a La Nina season following the strong El Nino from 2023. 1973,1988,1998 and 2010. The top 20 impacted in any of those years Mole St Nicolas Haiti 3, Cancun MX, Cozumel MX, Honduras, Miami FL, Nuevitas CU, Port Salut Haiti each with 2 . Abaco & Andros BAH, Brownsville TX, Manzanillo CU, Morgan city LA, with 1.
  • Statistically due or overdue for 40+ mph includes brushes. Only four areas were overdue in top 20 Andros, Bimini and Nassau BAH and Pensacola FL 1 year overdue, with Abaco BAH, Cancun & Cozumel MX, Cayman islands, Ft Lauderdale, Miami and Palm bch FL, Mole st Nicolas Haiti (nw) all due.
  • Statistically due or overdue for a hurricane strike 10 of the 20 years overdue Nassau BAH 1, Manzanillo CU 2, Morgan city LA 2, Cayman isl 9, Honduras 11, Ft Lauderdale & Palm bch 12, Bimini BAH 13, Miami FL 13, Brownsville 23.
  • Average number of named storms when hit by a hurricane 15+ named storms zero none met criteria.
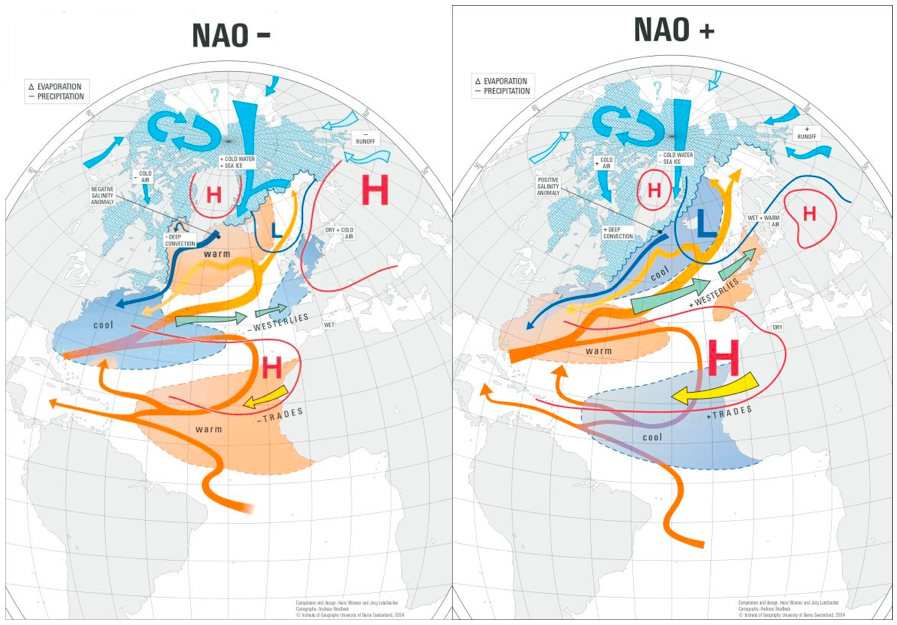
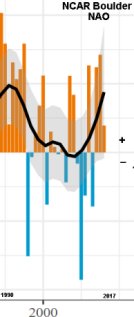
  • Impacted in seasons when between June and November the dominant feature was a Neutral North Atlantic oscillation. No one knows what the NAO will be at this time but I deployed AI to do a sequence using historical data and it chose Neutral. Based on a neutral NAO cities/islands with 4 plus impacts since 1990 are listed. Abaco isl BAH 4, Elizabeth city & Morehead city NC 4. To follow the NAO stats check https://www.cpc.ncep.noaa.gov/products/precip/CWlink/pna/norm.nao.monthly.b5001.current.ascii.table
  • Trends going back to 1871 I try to figure out patterns such as if a city was impacted in 2023 how how often do they get impacted the following year. If it was last impacted 3 years ago how often do they get impacted 3 years later. In my top 20 nine of those have unique trends with Cancun MX winning that criteria. Last impacted 3 years ago they have been impacted 3 years later 7 times.
  • CSU analog years additional years to the ones I chose above are 1878 and 1926 so who got impacted most during those years? 9 of my 20 matched both years. Abaco, Bimini and Nassau BAH , Miami, Ft Laud and Palm bch, Caymans, Manzanillo Cuba (se), Nuevitas Cuba (north c).
  • Were any of my top 20 picked last year? each year my picks don’t get impacted the following year odds go up they will be. Four were picked last year Abaco,, Andros, Bimini and Nassau.
  • Who in my top 20 get impacted during the expected La Nina seasons? 6 of the 20 are in the top 1/3 of locations impacted in La Nina years. The winner in this criteria is Elizabeth city, NC with 11 impacted since 1950 next was Honduras with 10.

Chart showing criteria with yellow shaded areas winning each criteria. Areas with the most yellow are higher ranked. Tie breakers are based on strength of systems or amount of impacts. #1) Great Abaco Island Bahamas has 3 with 1926 analog weighing huge.

Now you may ask what criteria do you put the most weight on?, the two most important especially when figuring my top 20 are overdue all storms and trends going back to 1871. You also may ask why was my city or island not included in your top 20? Areas on the bubble were Puerto Rico which did match CSU analogs 1878 and 1926, Lesser Antilles including ABC islands overdue for hurricane strike and analog 1988 , Nicaragua analog 1988 ,2010, N.E US analog 1878. It seems as though in years with La Nina conditions stronger ridging takes place pushing systems further west and south which would impact the Caribbean and Gulf much more.

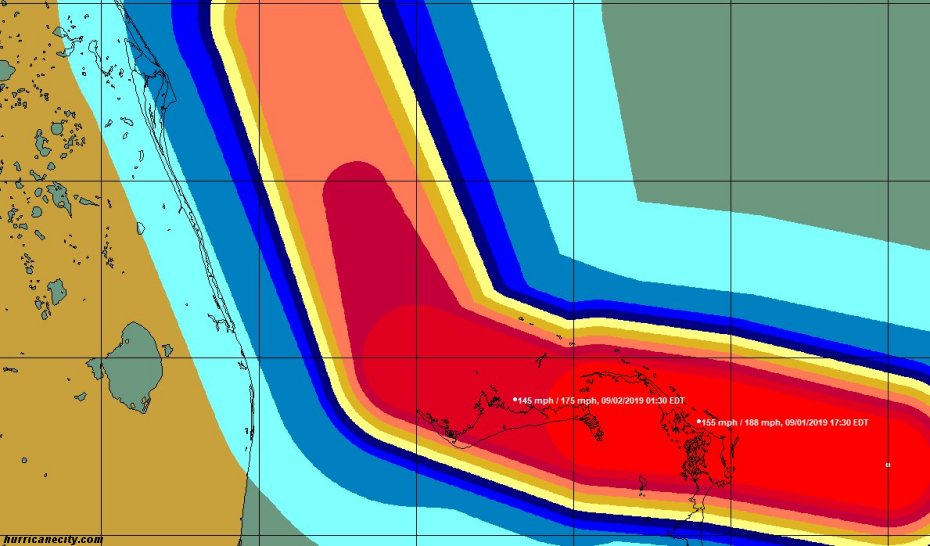
Each season I do landfall predictions I make a map with two dominant tracks I think could happen. These have been surprisingly good in some years practically matching tracks that actually happened. Below are the tracks with one mid season and one late I added potential width of hurricane force winds. This will forever be known as the pitchfork map if I end up being correct..

I know some of you that watched the video are wondering what was that explosion noise for Miami. That is my ticking time bomb pick for 2024 reserved for areas that are way overdue especially for hurricanes.

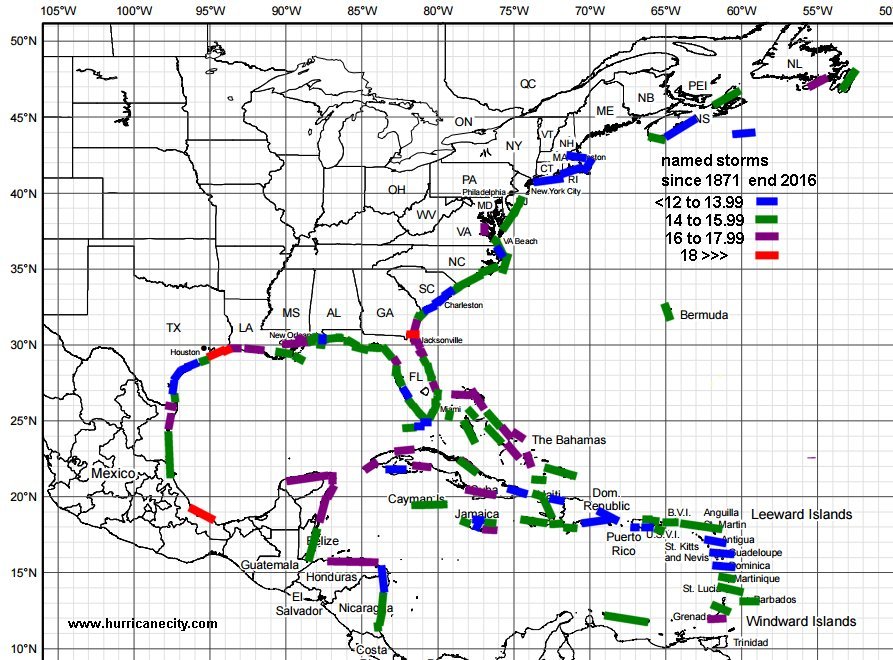
Miami has a hurricane return rate of once every 12.67 years since 1871 for the core of a hurricane to give the city hurricane force winds. Miami’s last direct impact was hurricane Wilma in 2005 Irma in 2017 was too far west and south so statistically should have been hit by 2010 so we are now approaching 15 years past that due date. This is extremely rare for Miami to go this long without a hurricane hit . Last time this happened was from 1966 Inez to hurricane Andrew 1992 or 26 years.

I cannot emphasize enough that if your city/island is not on this list does not mean you won’t be hit. Last year the hardest hit area Steinhatchee, FL was hit by Idalia as a cat 3, I did not have this area in my top 20.

All residents in the Atlantic basin need to pay close attention as the season progresses for threats to their cities and be prepared in advance. I suspect a good deal of the 139 locations in the HC database will be impacted this season, so now is the time to discuss your plans.

I will be live covering hurricanes making landfall at hurricanecity.com and providing the heads up to my mailing list which you can join by making a donation of $20.00 https://hurricanecity.com/donate.htm. To see my past years predictions and see how it played out visit my predictions page which goes back 20 years . To wrap things up I hope if your city is impacted from my list you email me to let me know and media that has any questions regarding these predictions can email me jim@hurricanecity.com , be safe and thank you for your time….Jim Williams

2021 Hurricane season what cities were impacted most?

Jim Williams Nov 30th,2021

With all the talk each hurricane season about how many named storms there will be or how much accumulated cyclone energy will be generated what mainly matters is where they will go, will they hit land & where?

The database here at hurricanecity.com list’s 139 cities/islands in the Atlantic basin as evenly spread out as possible. If any of these locations were impacted by a named storm with 40+ mph it counts as an impact even as post tropical. So how did this past hurricane season compare to the extremely active 2020 season which had 30 named storms?

This year the Atlantic basin churned out 21 named storms during the 21 season how ironic.  Out of those 21 named storms 10 impacted one or more of the 139 locations or 47.62%.  Now compare this to 2020 with 30 named storms had a higher percentage of impacts 17 or 56.67% of all storms impacted land. The 2020 hurricane season also had far more hurricane impacts especially on the U.S mainland than 2021 did.

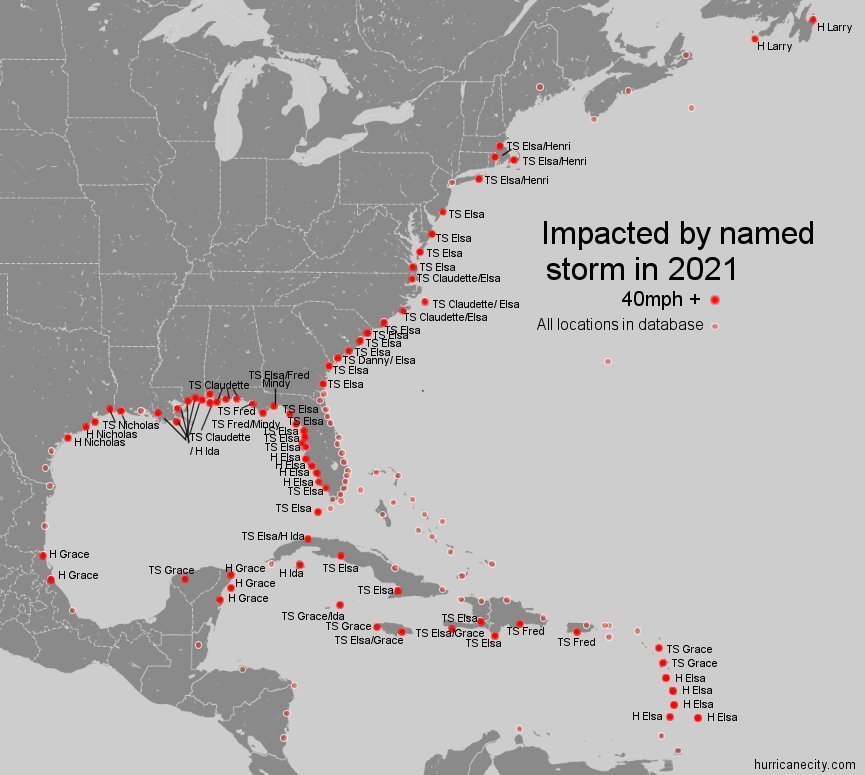
Hit map for 2021
Map showing 40mph + impacts for 2021

Of the 10 impacts in 2020 half caused significant disruptions to everyday life which is really what matters considering the entire hurricane season which runs from June 1st through November 30th.

 wind swath map

The most impactful hurricanes of 2021 were.

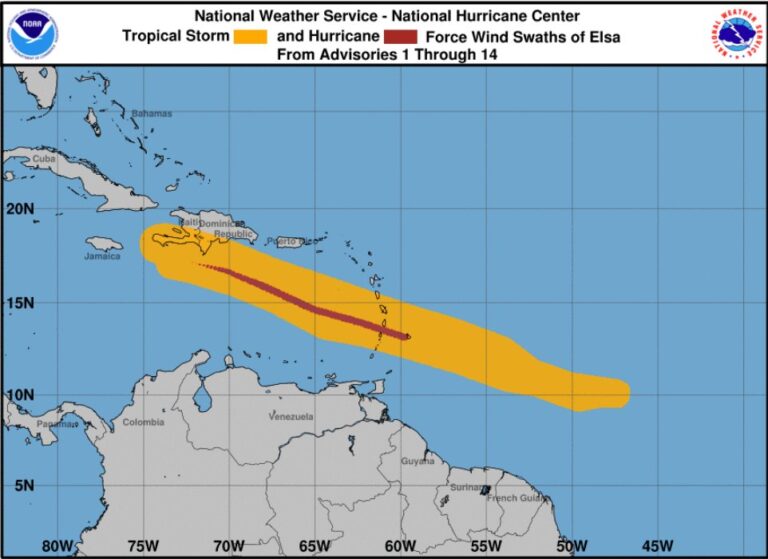
Hurricane Elsa early false alarm.

Hit the Windward islands on July 2nd with 85mph winds 743 roofs damaged. Database impacts: Dominica, Martinique, St Vincent brushed. Barbados, St Lucia, St Vincent hit.

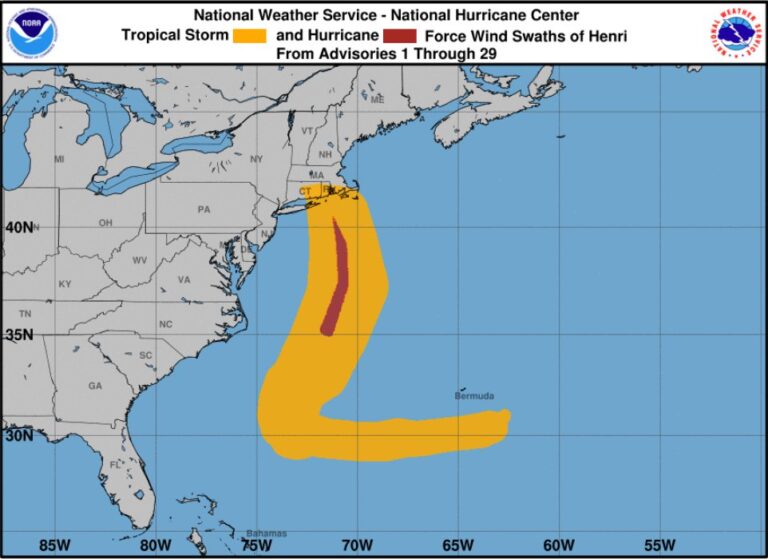
NHC wind swath map for Henri

Biggest tease

Hurricane Henri moved towards eastern Long Island and weakened to a tropical storm as it moved in on August 22nd but still caused significant damage & power outages in the N.E. 

Database impacts: Southampton LI ,Providence R.I, Cape Cod MA TS hit.

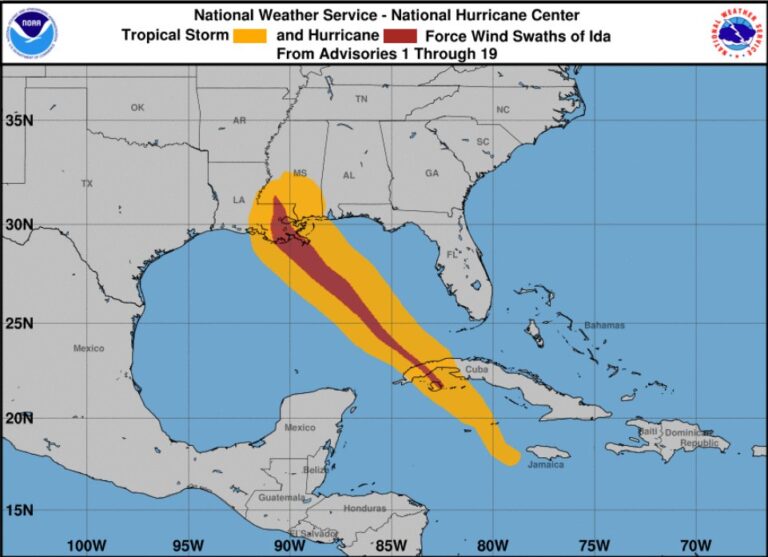
NHC wind swath Ida

The biggest hit & story of the season.

Hurricane Ida hitting S.E Louisiana on August 29th with 150mph winds causing extreme damage and massive power outages.  Database impacts: Caymans TS br, Havana ,Cienfuegos CU br, Isle of youth, CU hit. Morgan city,LA ,Bay St Louis, Biloxi, Pascagoula MS all br, Grand Isle, New Orleans LA hits.

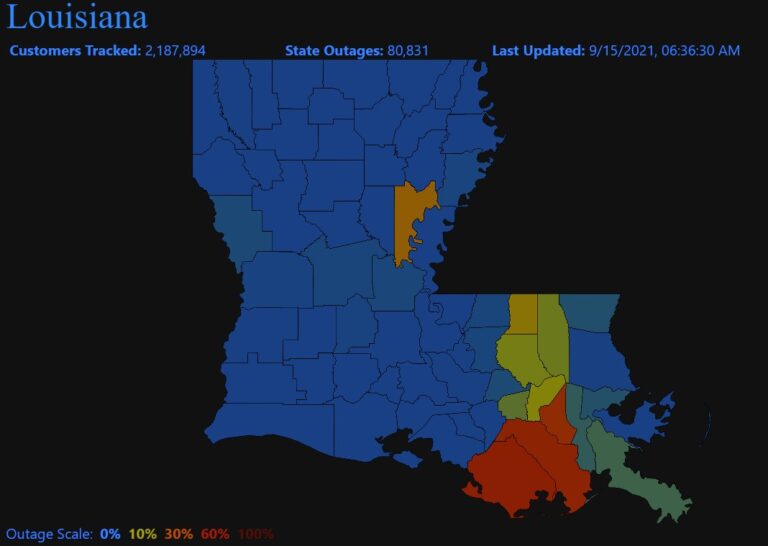
Power outage map Ida from poweroutage.us

For many of the impacted areas in Red courtesy of poweroutage.us they were without power for several weeks.

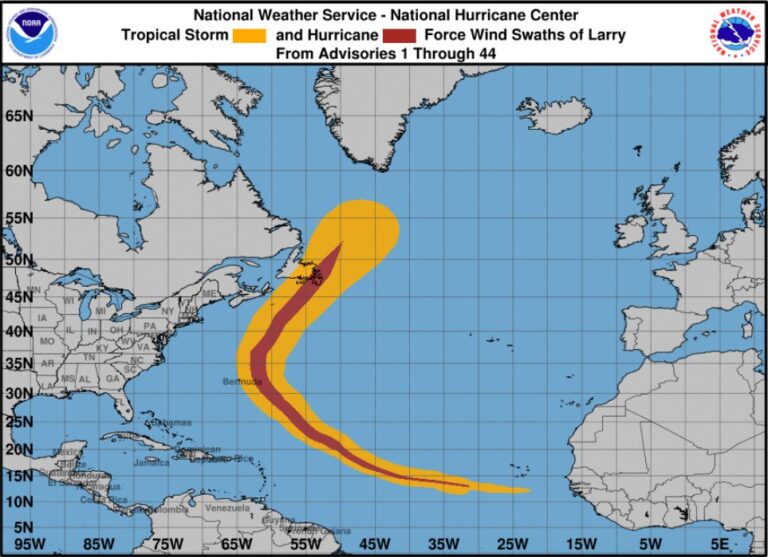
Typical September recurve.

Hurricane Larry hit eastern Newfoundland with 75mph winds on September 11th causing wide spread power outages. Database impacts: St Pierre NF, br , St Johns NF hit.

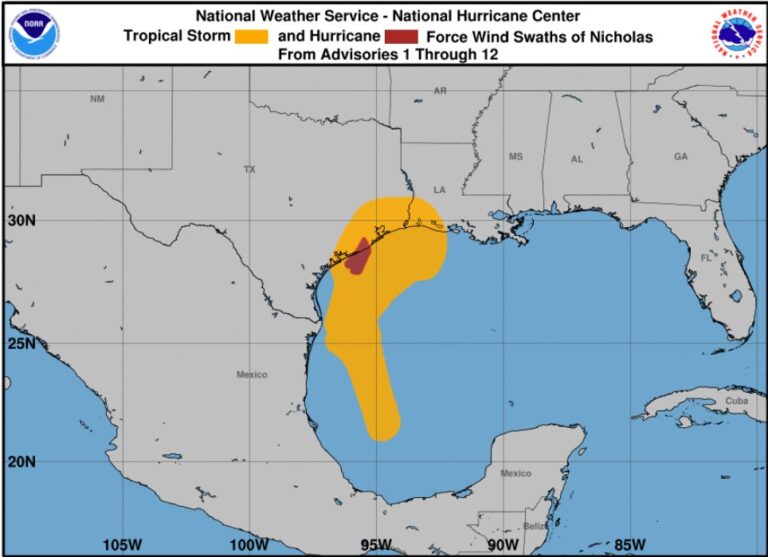
National Hurricane Center Nicholas wind swath map

Packed a punch over small area.

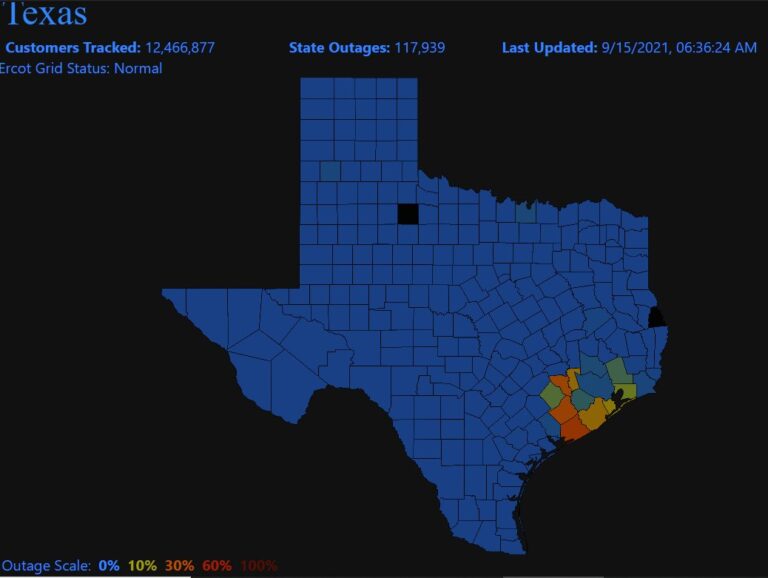
Hurricane Nicholas hit the upper Texas coast on September 14th with 75mph winds causing a large amount of power outages. Database impacts: Pt O’Connor ,Galveston, Pt Arthur all TS, Freeport TX hurricane hit.

Nicholas outage map

Widespread power outage as a result of Hurricane Nicholas but most power was restored rather quickly.

Hurricanecity coverage of hurricanes in 2021

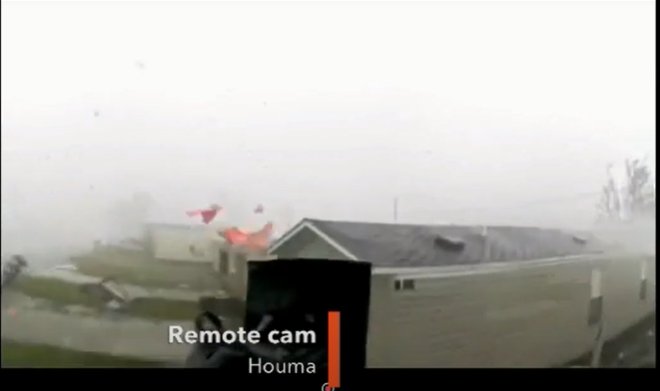
Looking back on the 2021 hurricane season there was one major headliner hurricane Ida which slammed S.E Louisiana on August 29th with 150mph winds. After the 2010 hurricane season it became clear that the way we would cover hurricanes had to change. Showing live streaming chaser feeds and webcams on the traditional “hurricane warning shows” became increasingly difficult due to copyright issues. With live streaming technology as well as the ability to stream to several media platforms at the same I decided it was time to hit the road and cover the hurricanes as in person as they hit. Since that time I have produced live video from hurricanes Matthew, Irma, Michael, Sally, Delta and this past season Hurricane Ida. This was a difficult hurricane to intercept as the track kept shifting east and the storm surge threat was forecast by the National Hurricane Center to be catastrophic in the areas I needed to be. This is where we use our remote live cell tower capable streaming cams which worked perfectly in 2020 capturing storm surges in Sally & Delta. My home base for Ida was in Morgan City Louisiana which turned out to be beneficial and having power post landfall. I traveled to Houma, Louisiana where the town was expected to go underwater and the eye was forecast to hit. I set up my one cam to work with on this trip , the other cam never made it due to fedex not arriving in time. I found a row of mobile homes across from the Heliport in S.E Houma and decided to strap the remote cam I had to a pole along side the mobile homes. Not only was I expecting these homes to get destroyed but the surge was supposed to come up to about the height of the cam around 10ft.
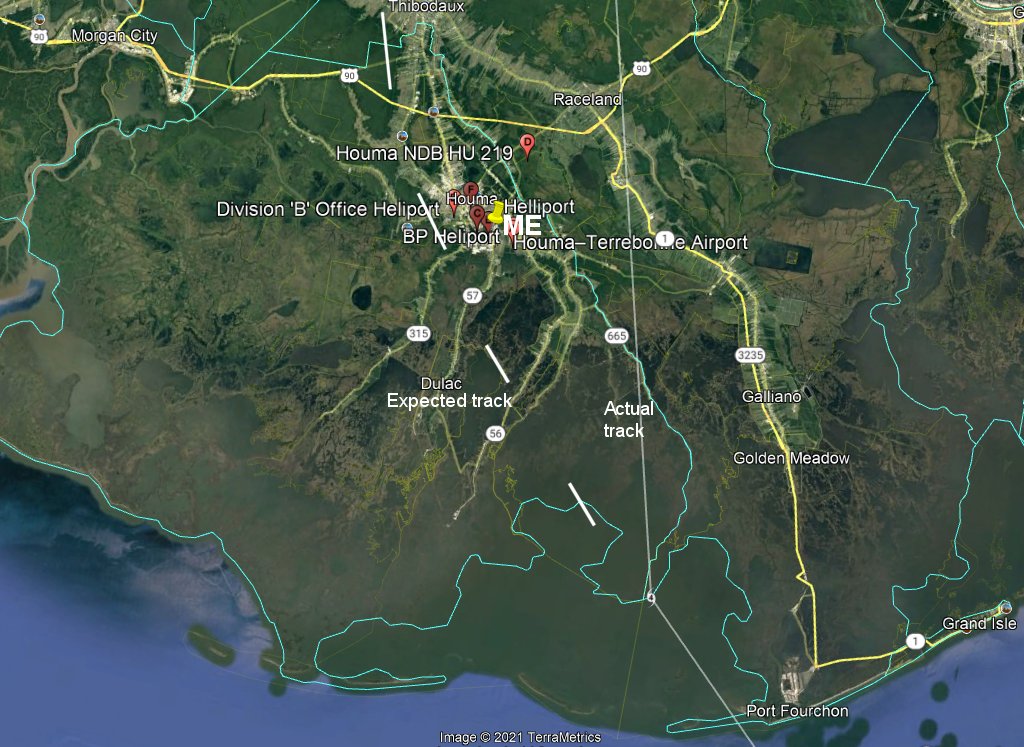
My remote cam location as Hurricane Ida hit.

As it turned out the power pole I attached the cam to got blown over in the wind. As you can see in this video the 3rd mobile home from the camera which was blocked by the others got blown to pieces. Towards the end of the video I drive through the impacted areas showing the heavy damage.

Half way through the hurricane warning show the remote cam captures the home being destroyed https://www.youtube.com/watch?v=qiOP2cPXscI

Each year following the season the National Hurricane Center will release final reports on each system. We won’t know how many died & total damage amounts for 2021 until sometime in the spring, but one thing for certain is that 2021 was quieter than 2020. Indications are for damage totals to exceed $60 billion dollars for all storms which is higher than last years total because of Ida damage. If you live in S.E Louisiana where Hurricane Ida hit, the season was devastating and it will take some of these areas years to recover. Where they go matters thank you for your support & I’ll see you next hurricane season which starts on June 1st. ..Jim Williams